Adaptive Shrinkage Estimation for Personalized Deep Kernel Regression in Modeling Brain Trajectories
1Center for AI and Data Science for Integrated Diagnostics, University of Pennsylvania
2Department of Bioengineering, University of Pennsylvania
3Department of Biostatistics, Epidemiology and Informatics, University of Pennsylvania
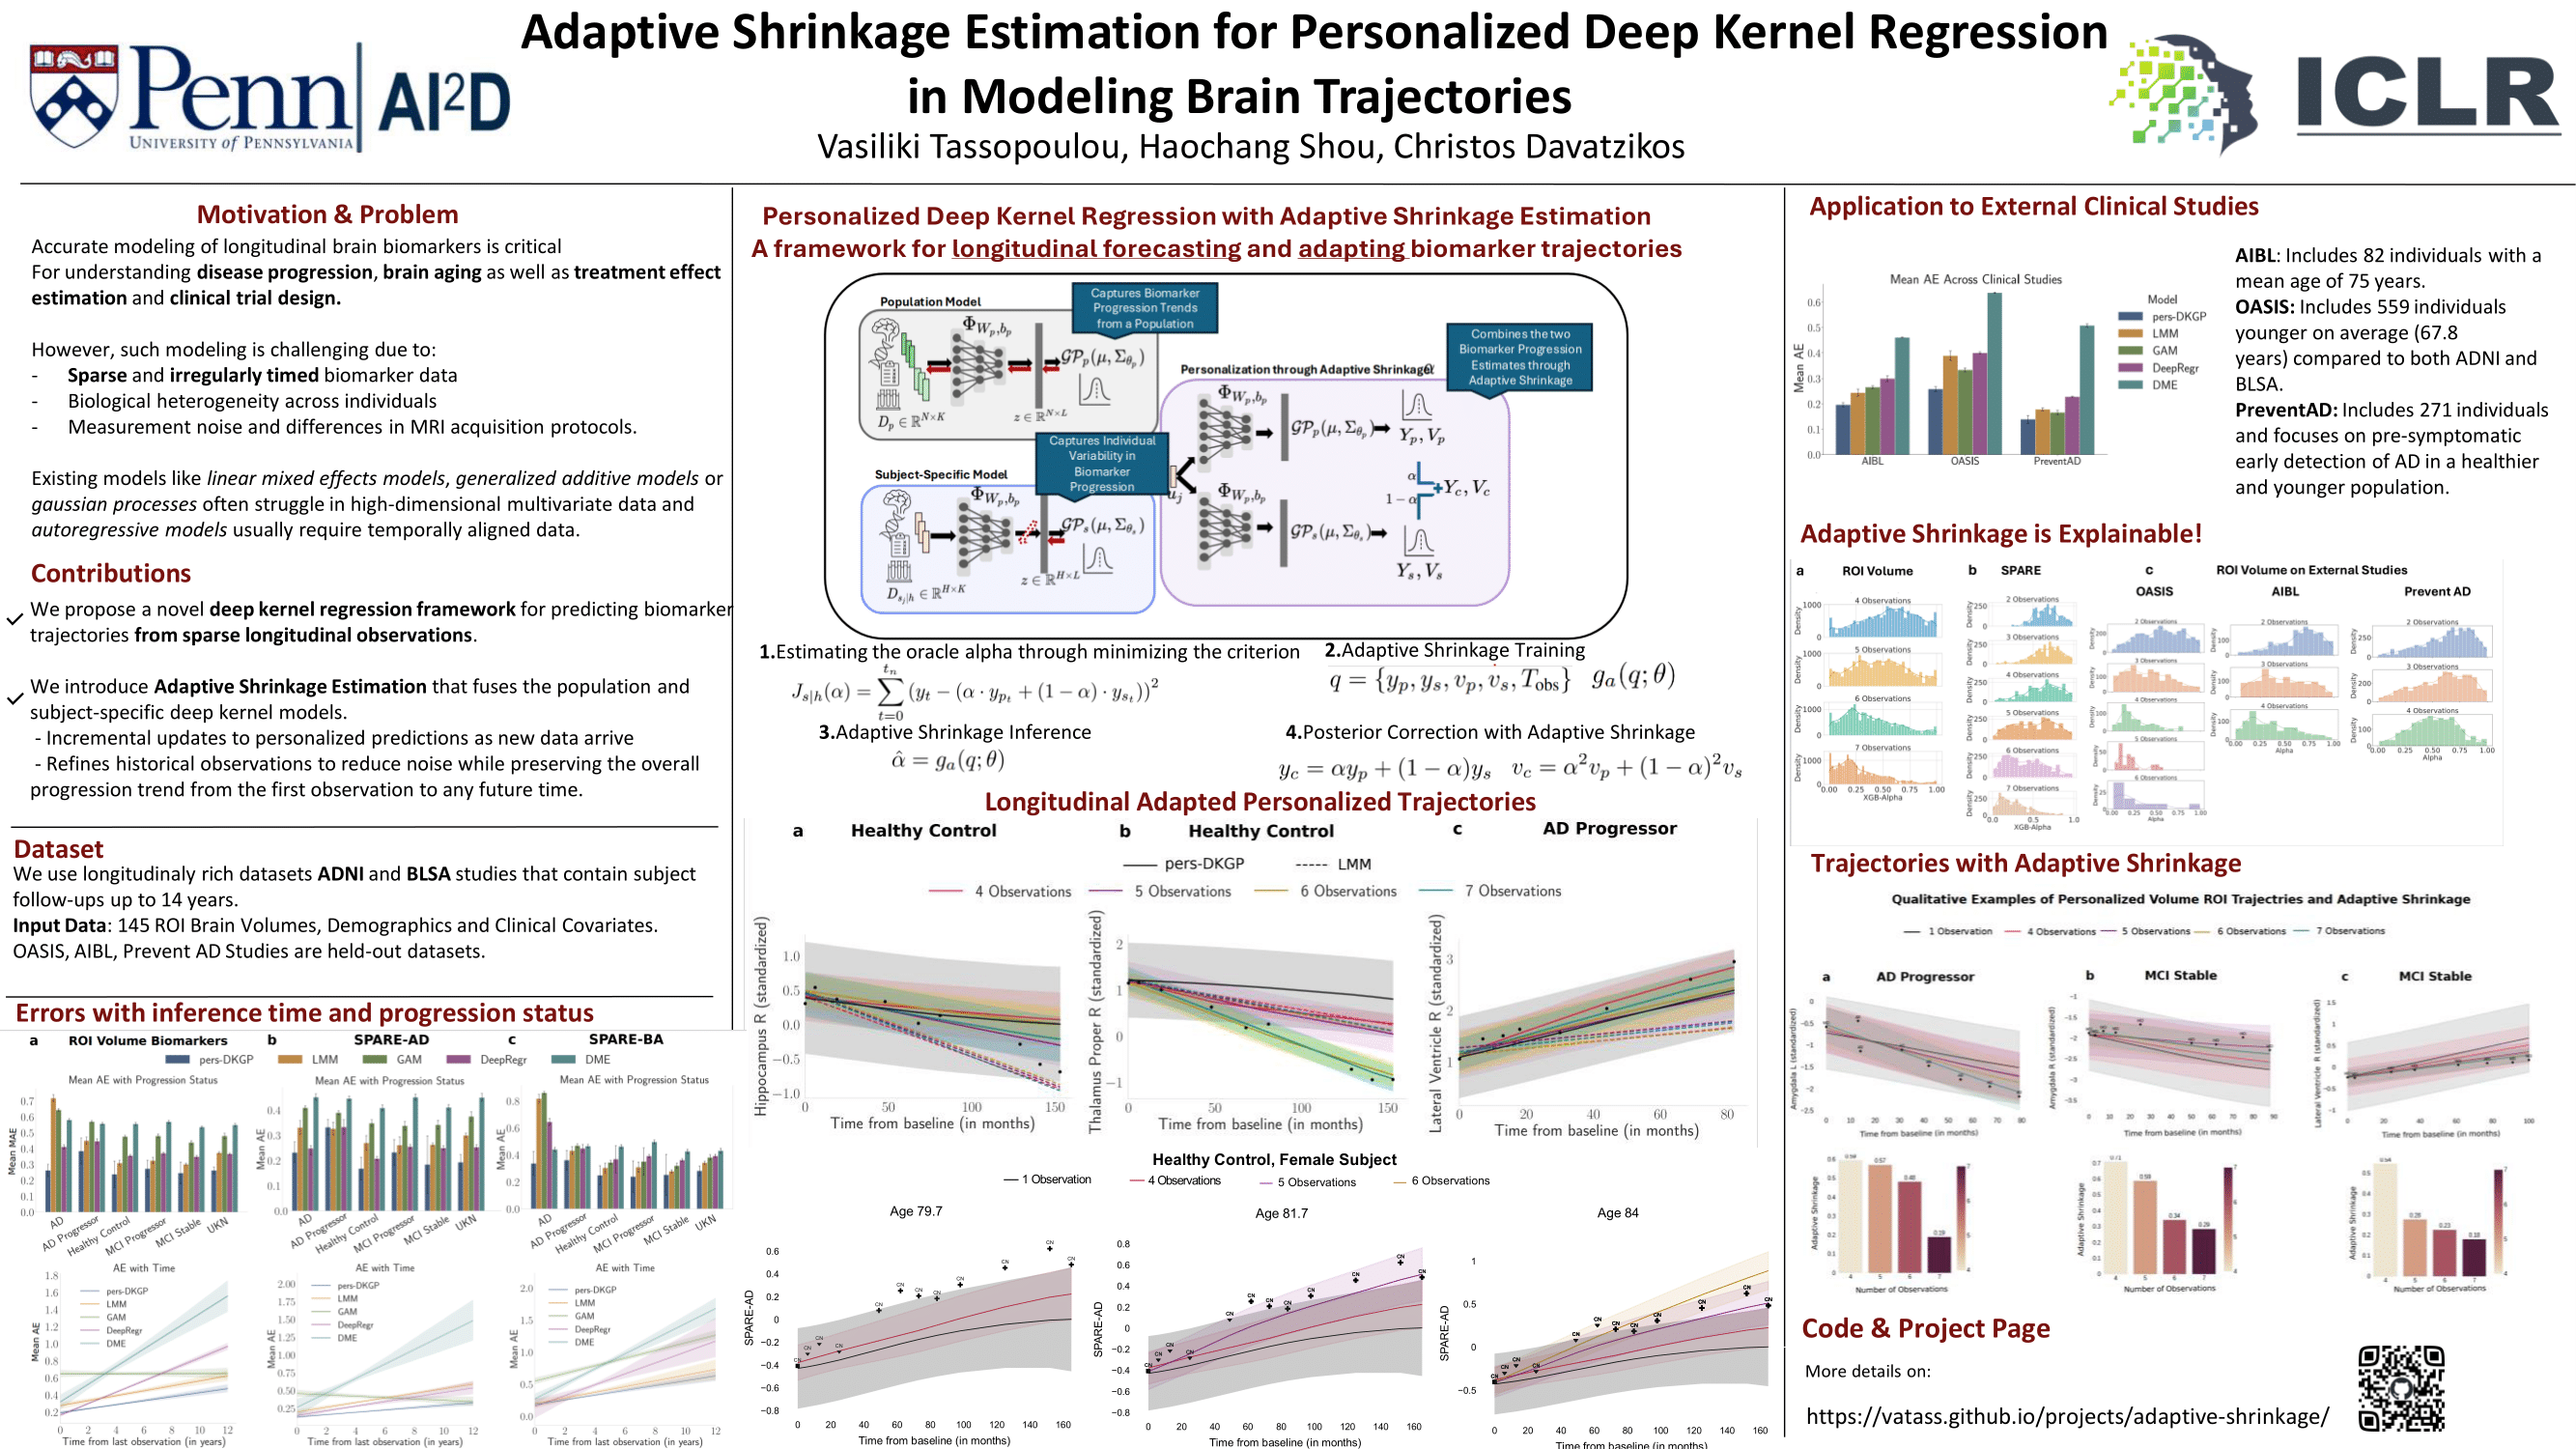
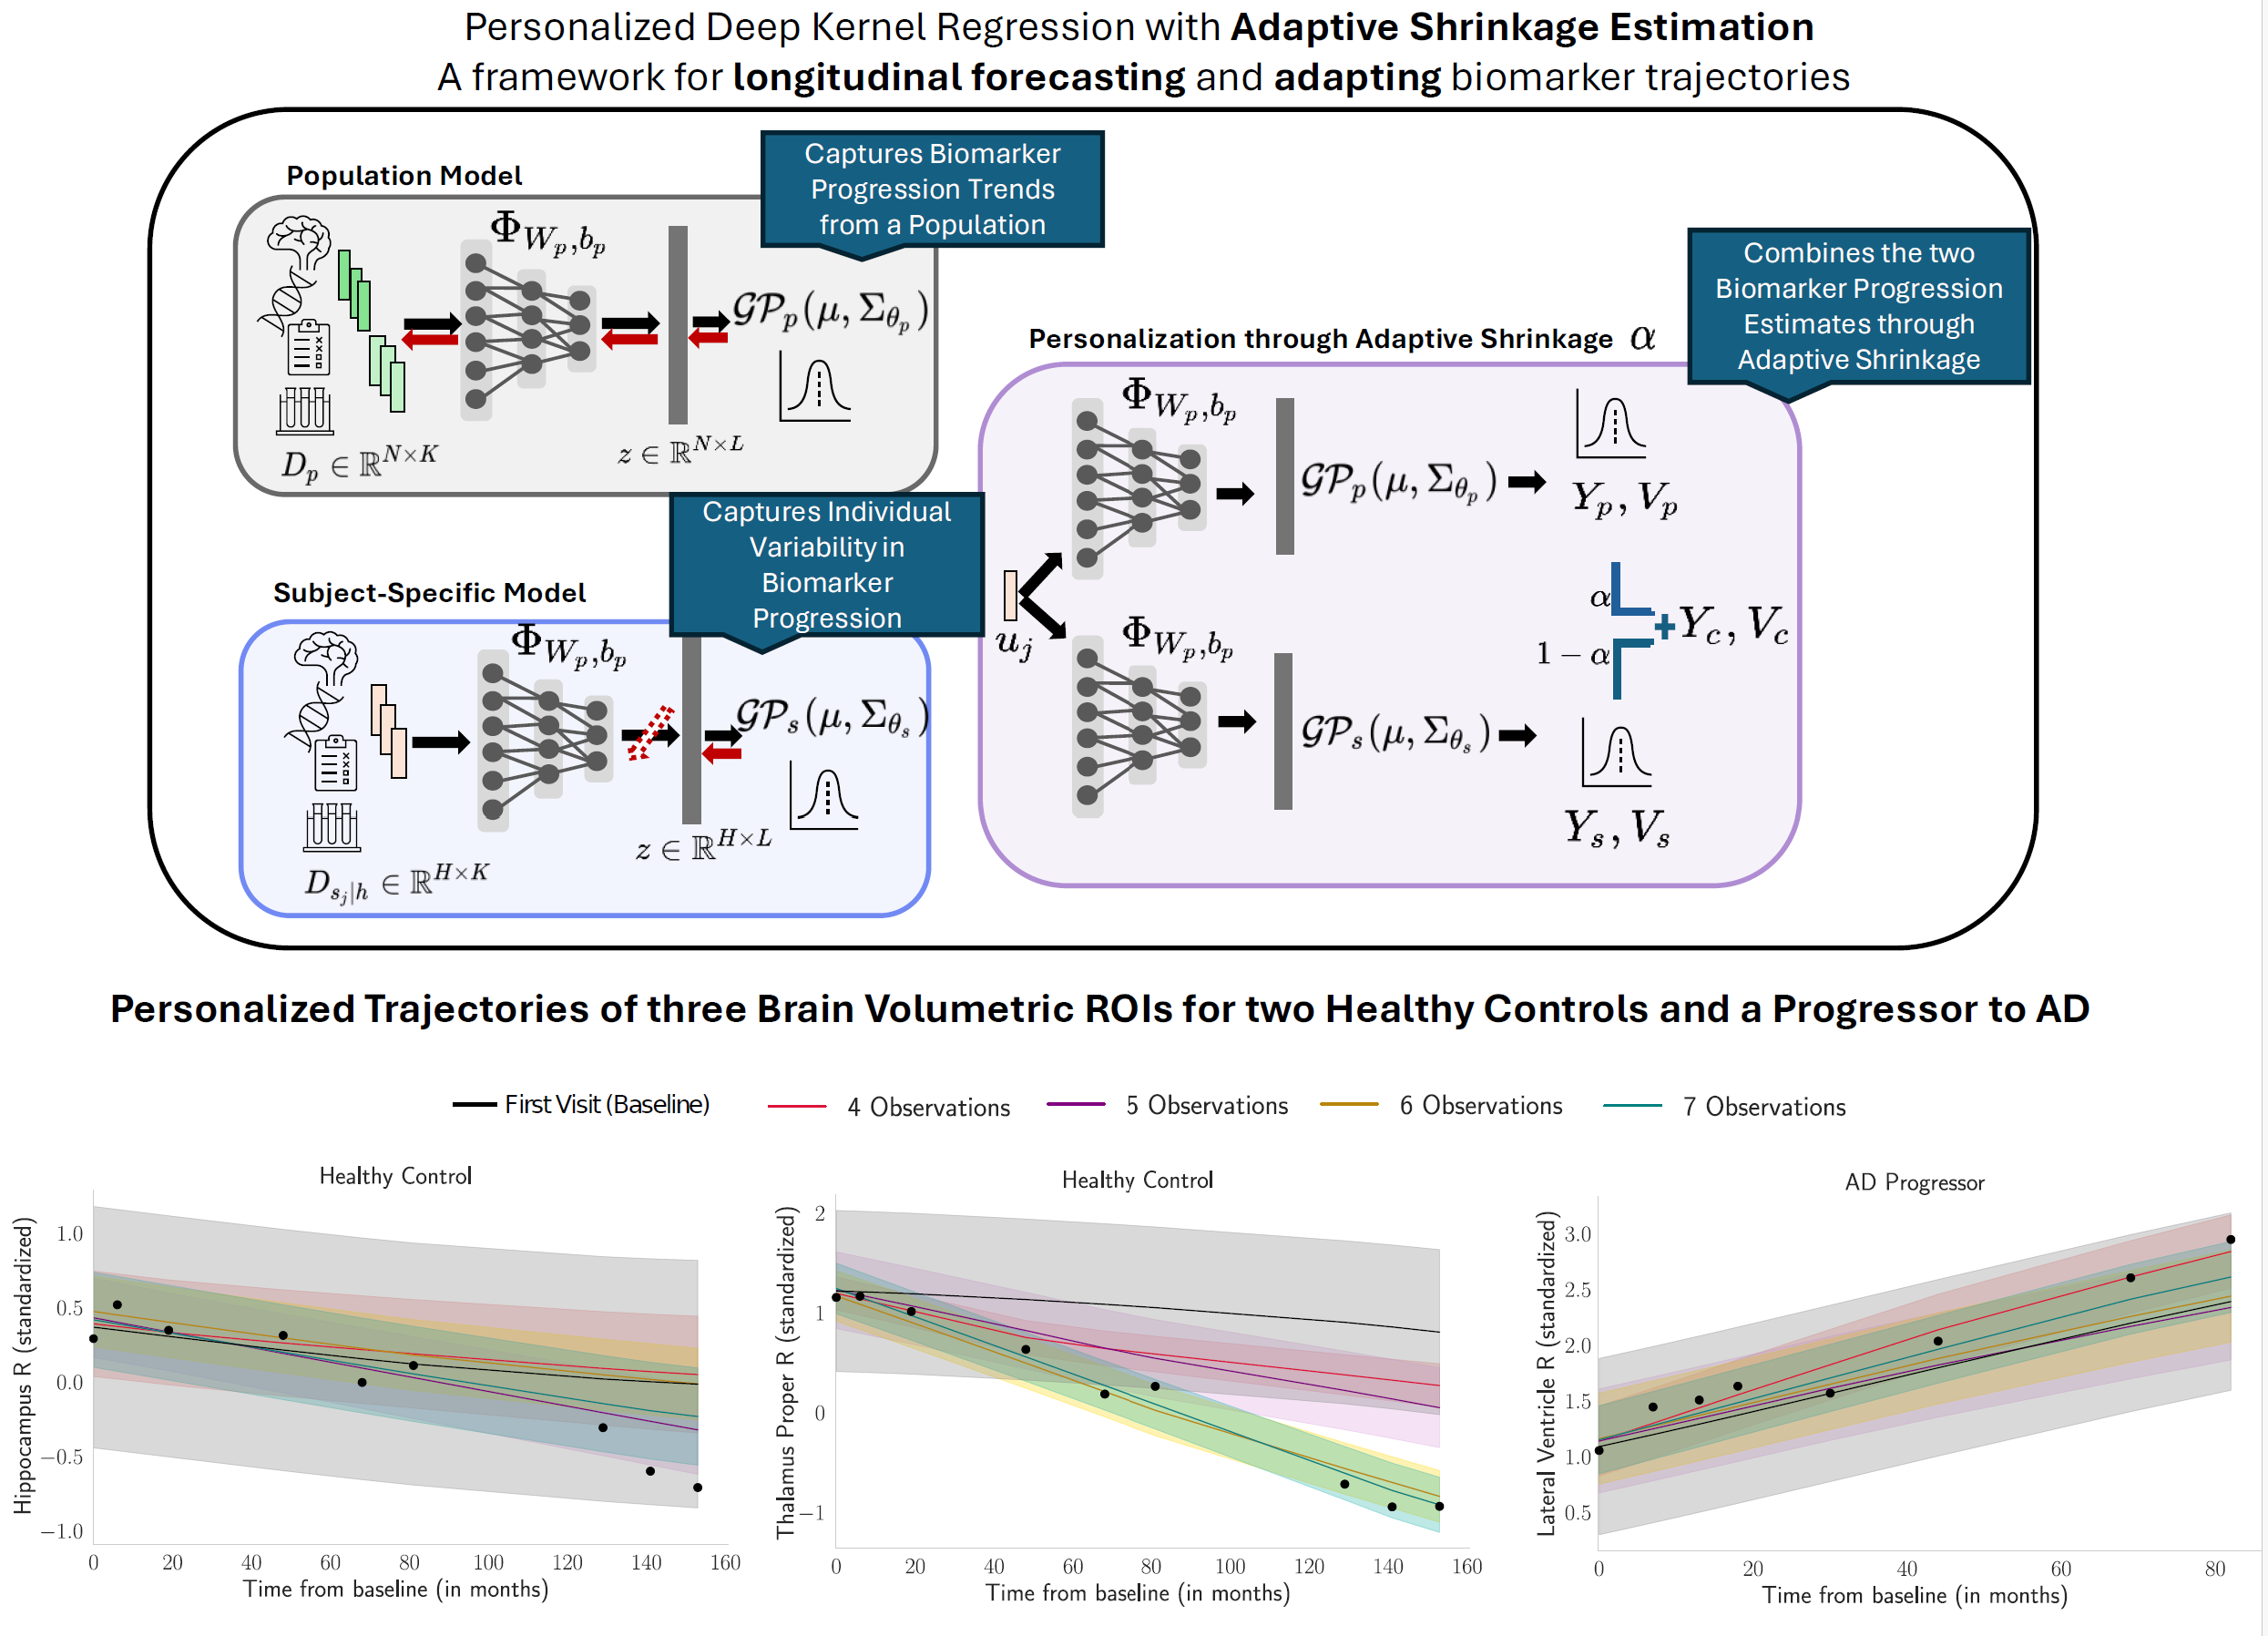 Figure: Our framework combines a population-level deep kernel Gaussian process (p-DKGP) and a subject-specific model (ss-DKGP), integrating them through Adaptive Shrinkage Estimation to personalize brain biomarker trajectory predictions.
Abstract
Understanding how brain biomarkers change over time is crucial for diagnosing and tracking neurological diseases like Alzheimer's. However, predicting these biomarker trajectories is challenging due to biological variability, inconsistent imaging protocols, and sparse, irregular data collection. Our recent work, presented at ICLR 2025, introduces a new approach that tackles the afforementioned challenges: Adaptive Shrinkage Estimation for Personalized Deep Kernel Regression. This method provides a more accurate and personalized way to model brain changes over time.The Challenge: Predicting Brain Biomarkers Accurately
Longitudinal neuroimaging studies track changes in brain structure, but the data is often incomplete or misaligned across individuals. Traditional statistical models, such as linear mixed-effects models and generalized additive models, struggle to capture complex, non-linear brain trajectory patterns. On the other hand, deep learning models can learn from vast amounts of data but may not adapt well to individual patient variations.Datasets
We use the iSTAGING consortium [Habes et al., 2021] that consolidated and harmonized imaging and clinical data from multiple cohorts. Our real data consists of neuroimaging and demographic measures taken from subjects in the iSTAGING consortium. Specifically, the neuroimaging measures are the 145 anatomical brain ROI volumes (119 ROIs in gray matter, 20 ROIs in white matter and 6 ROIs in ventricles) extracted using a multi-atlas label fusion method [Doshi et al., 2016]. Our input consists of volumetric ROIs along with clinical covariates of Age, Sex, Diagnosis, Education Years and APOE4 Alleles at Baseline and the Time variable that represents the time in months from the baseline.Adaptive Shrinkage Estimation with Deep Kernel Learning
We propose a novel framework that balances global population trends with individual-specific nuances. Our approach, Deep Kernel Gaussian Processes with Adaptive Shrinkage Estimation, integrates two components: - Population Model (p-DKGP): Trained on large and longitudinally rich biomarker datasets to learn heterogeneous trajectory trends. - Subject-Specific Model (ss-DKGP): Personalized predictions based on an individual's follow-up data. As shown in the figure above, our method combines these components through Adaptive Shrinkage Estimation to create personalized predictions that are more accurate than either component alone.1. Predictive Posterior Correction
Given predictions $y_p$ and $y_s$ from the p-DKGP and ss-DKGP models, the personalized prediction is expressed as a linear combination: $$ y_c = \alpha y_p + (1 - \alpha) y_s $$ where $\alpha$ is the shrinkage parameter reflecting the relative confidence in each model. Assuming independence between the models, the combined prediction $y_c$ retains Gaussian properties, and its variance is given by: $$ v_c = \alpha^2 v_p + (1 - \alpha)^2 v_s $$ The weights $\alpha$ and $1 - \alpha$ quantify the credibility of each model, yielding a new posterior predictive mean $Y_c$ and variance $V_c$. Values of $\alpha$ close to 1 indicate higher confidence in p-DKGP model, while values close to 0 reflect greater trust in ss-DKGP model.2. Acquiring the Oracle Shrinkage $\alpha$
Estimating the oracle shrinkage parameter $\alpha$ is crucial for constructing the personalized posterior predictive means and variances of the biomarker trajectory. To estimate $\alpha$, we use a held-out set of subjects with known trajectories, unseen by the population model. Predictions for these subjects are generated using the p-DKGP model. For each subject, the ss-DKGP component is trained by progressively increasing the length of the observed trajectory. The entire biomarker trajectory is reconstructed from the baseline time $(t=0)$ to the subject's last time point $t_n$. Using both models, we obtain two estimates of the biomarker trajectory along with their predictive variances. Let $Y_p$ and $V_p$ denote the p-DKGP predictive mean and variance, and $Y_s$ and $V_s$ denote the ss-DKGP model predictive mean and variance. The oracle $\alpha$ is estimated by minimizing: $$ J_{s|h}(\alpha) = \sum_{t=0}^{t_n} \left(y_t - \left(\alpha \cdot y_{p_{t}} + (1 - \alpha) \cdot y_{s_{t}}\right)\right)^2 $$3. Oracle Shrinkage Estimation Algorithm
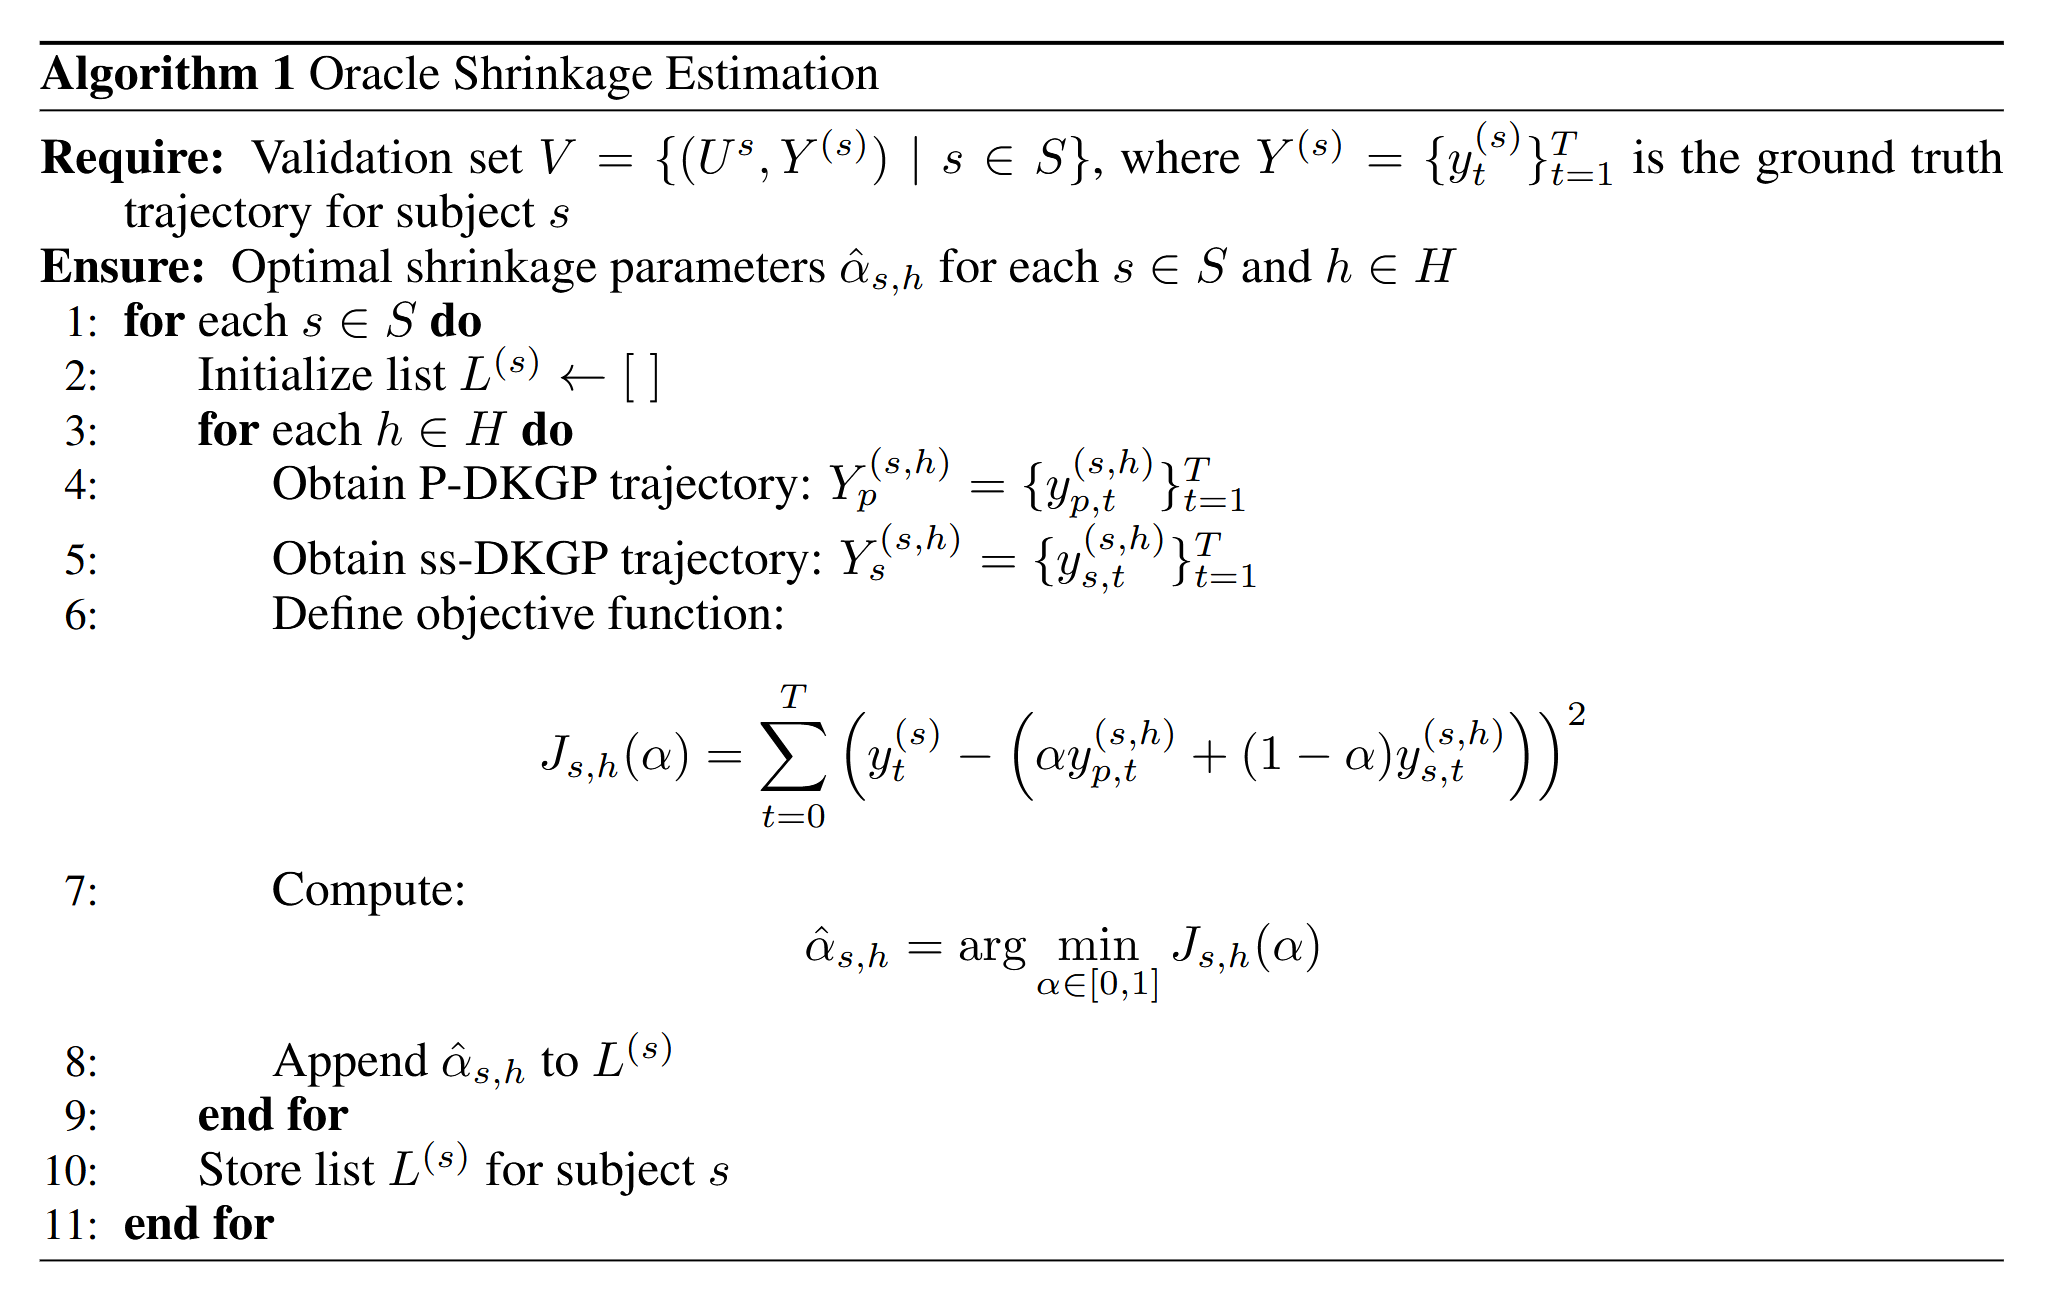 Algorithm 1: Oracle Shrinkage Estimation procedure showing the steps to compute optimal shrinkage parameters.
4. Learning the Adaptive Shrinkage $\alpha$
The shrinkage parameter $\alpha$ represents the trust factor between the two components. We model $\alpha$ as a function of the input variables $q = \{y_p, y_s, v_p, v_s, T_{\text{obs}}\}$, where $q \in \mathbb{R}^5$ and $T_{\text{obs}}$ represents the time of observation. Using oracle shrinkage $\alpha$, our objective is to learn a mapping function $g_{a}$ that transforms the input space to the output space of adaptive shrinkage: $$ \hat{\alpha} = g_{a}(q; \theta) $$ We employ XGBoost regression to learn the function $g$ that minimizes the difference between the predicted $\hat{\alpha}$ and the oracle $\alpha$.5. Personalization through Adaptive Shrinkage Estimation
For a new test subject with $h$ observations and $T_{\text{obs}}$ as the observation time, we implement the following algorithm: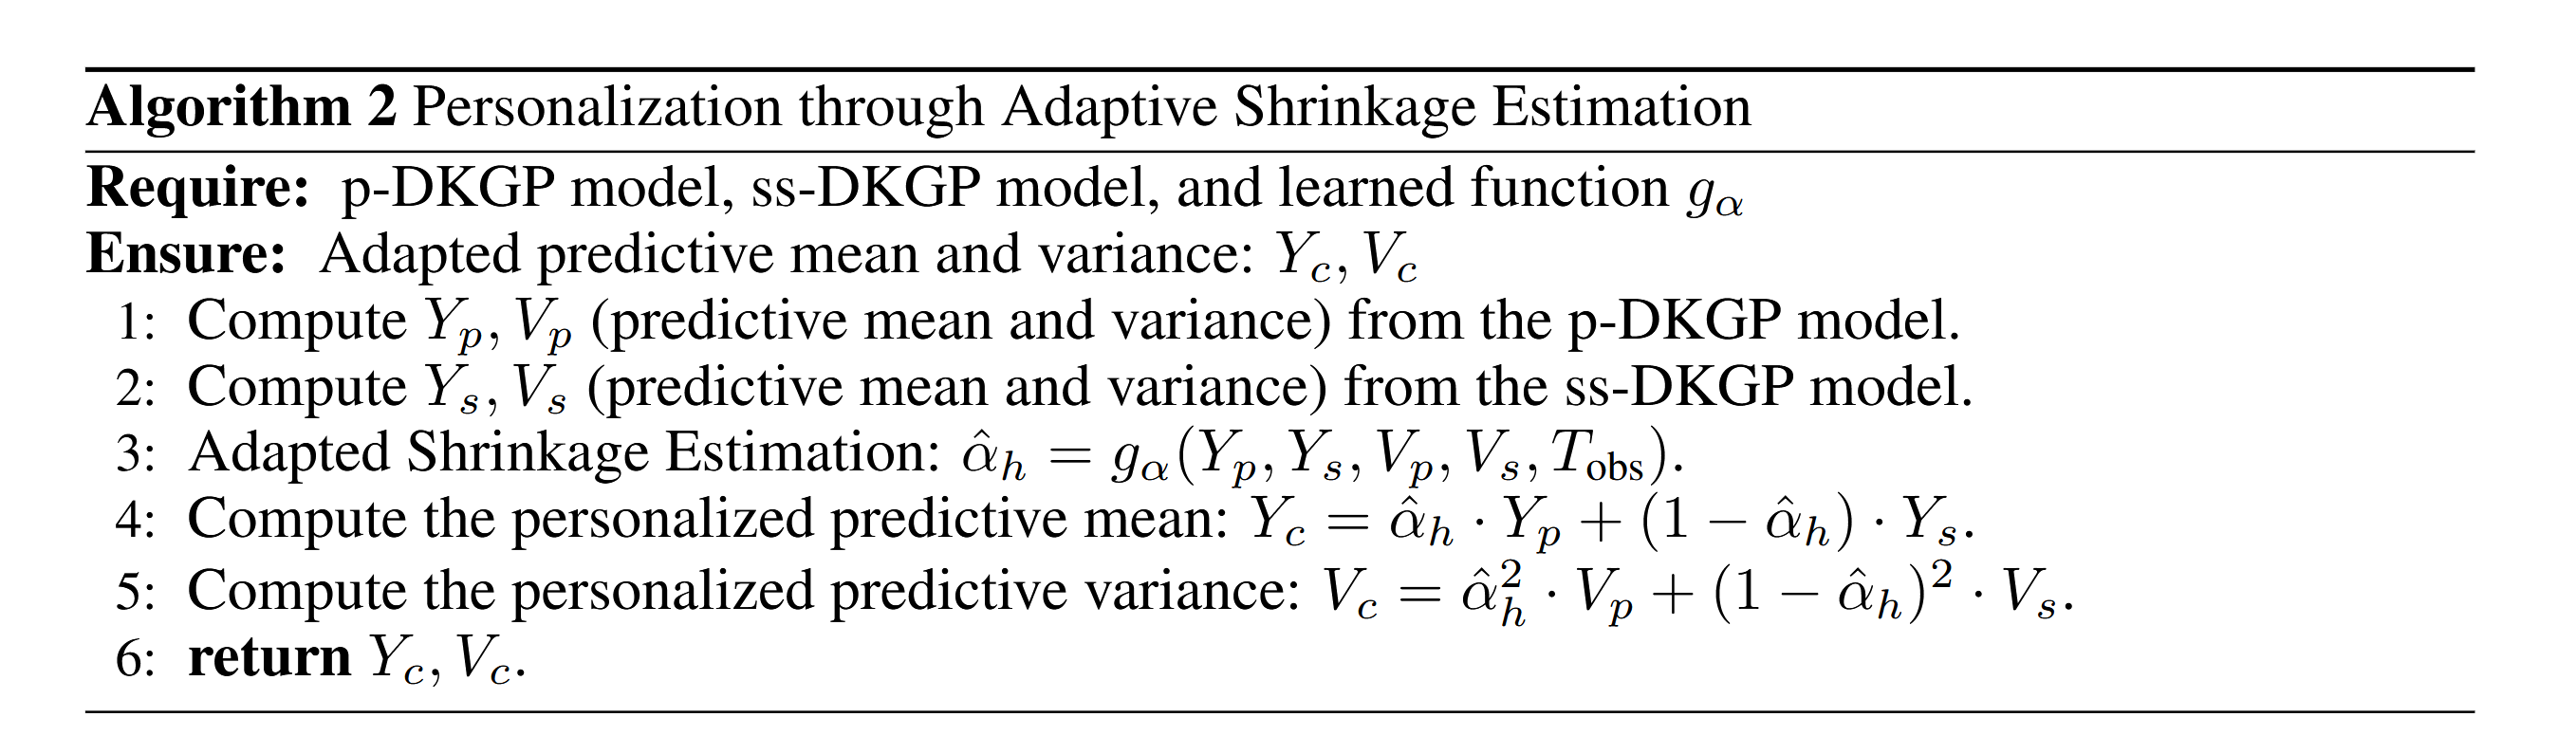 Algorithm 2: Personalization through Adaptive Shrinkage Estimation showing the steps to compute personalized predictions.
Results
Quantitative Results
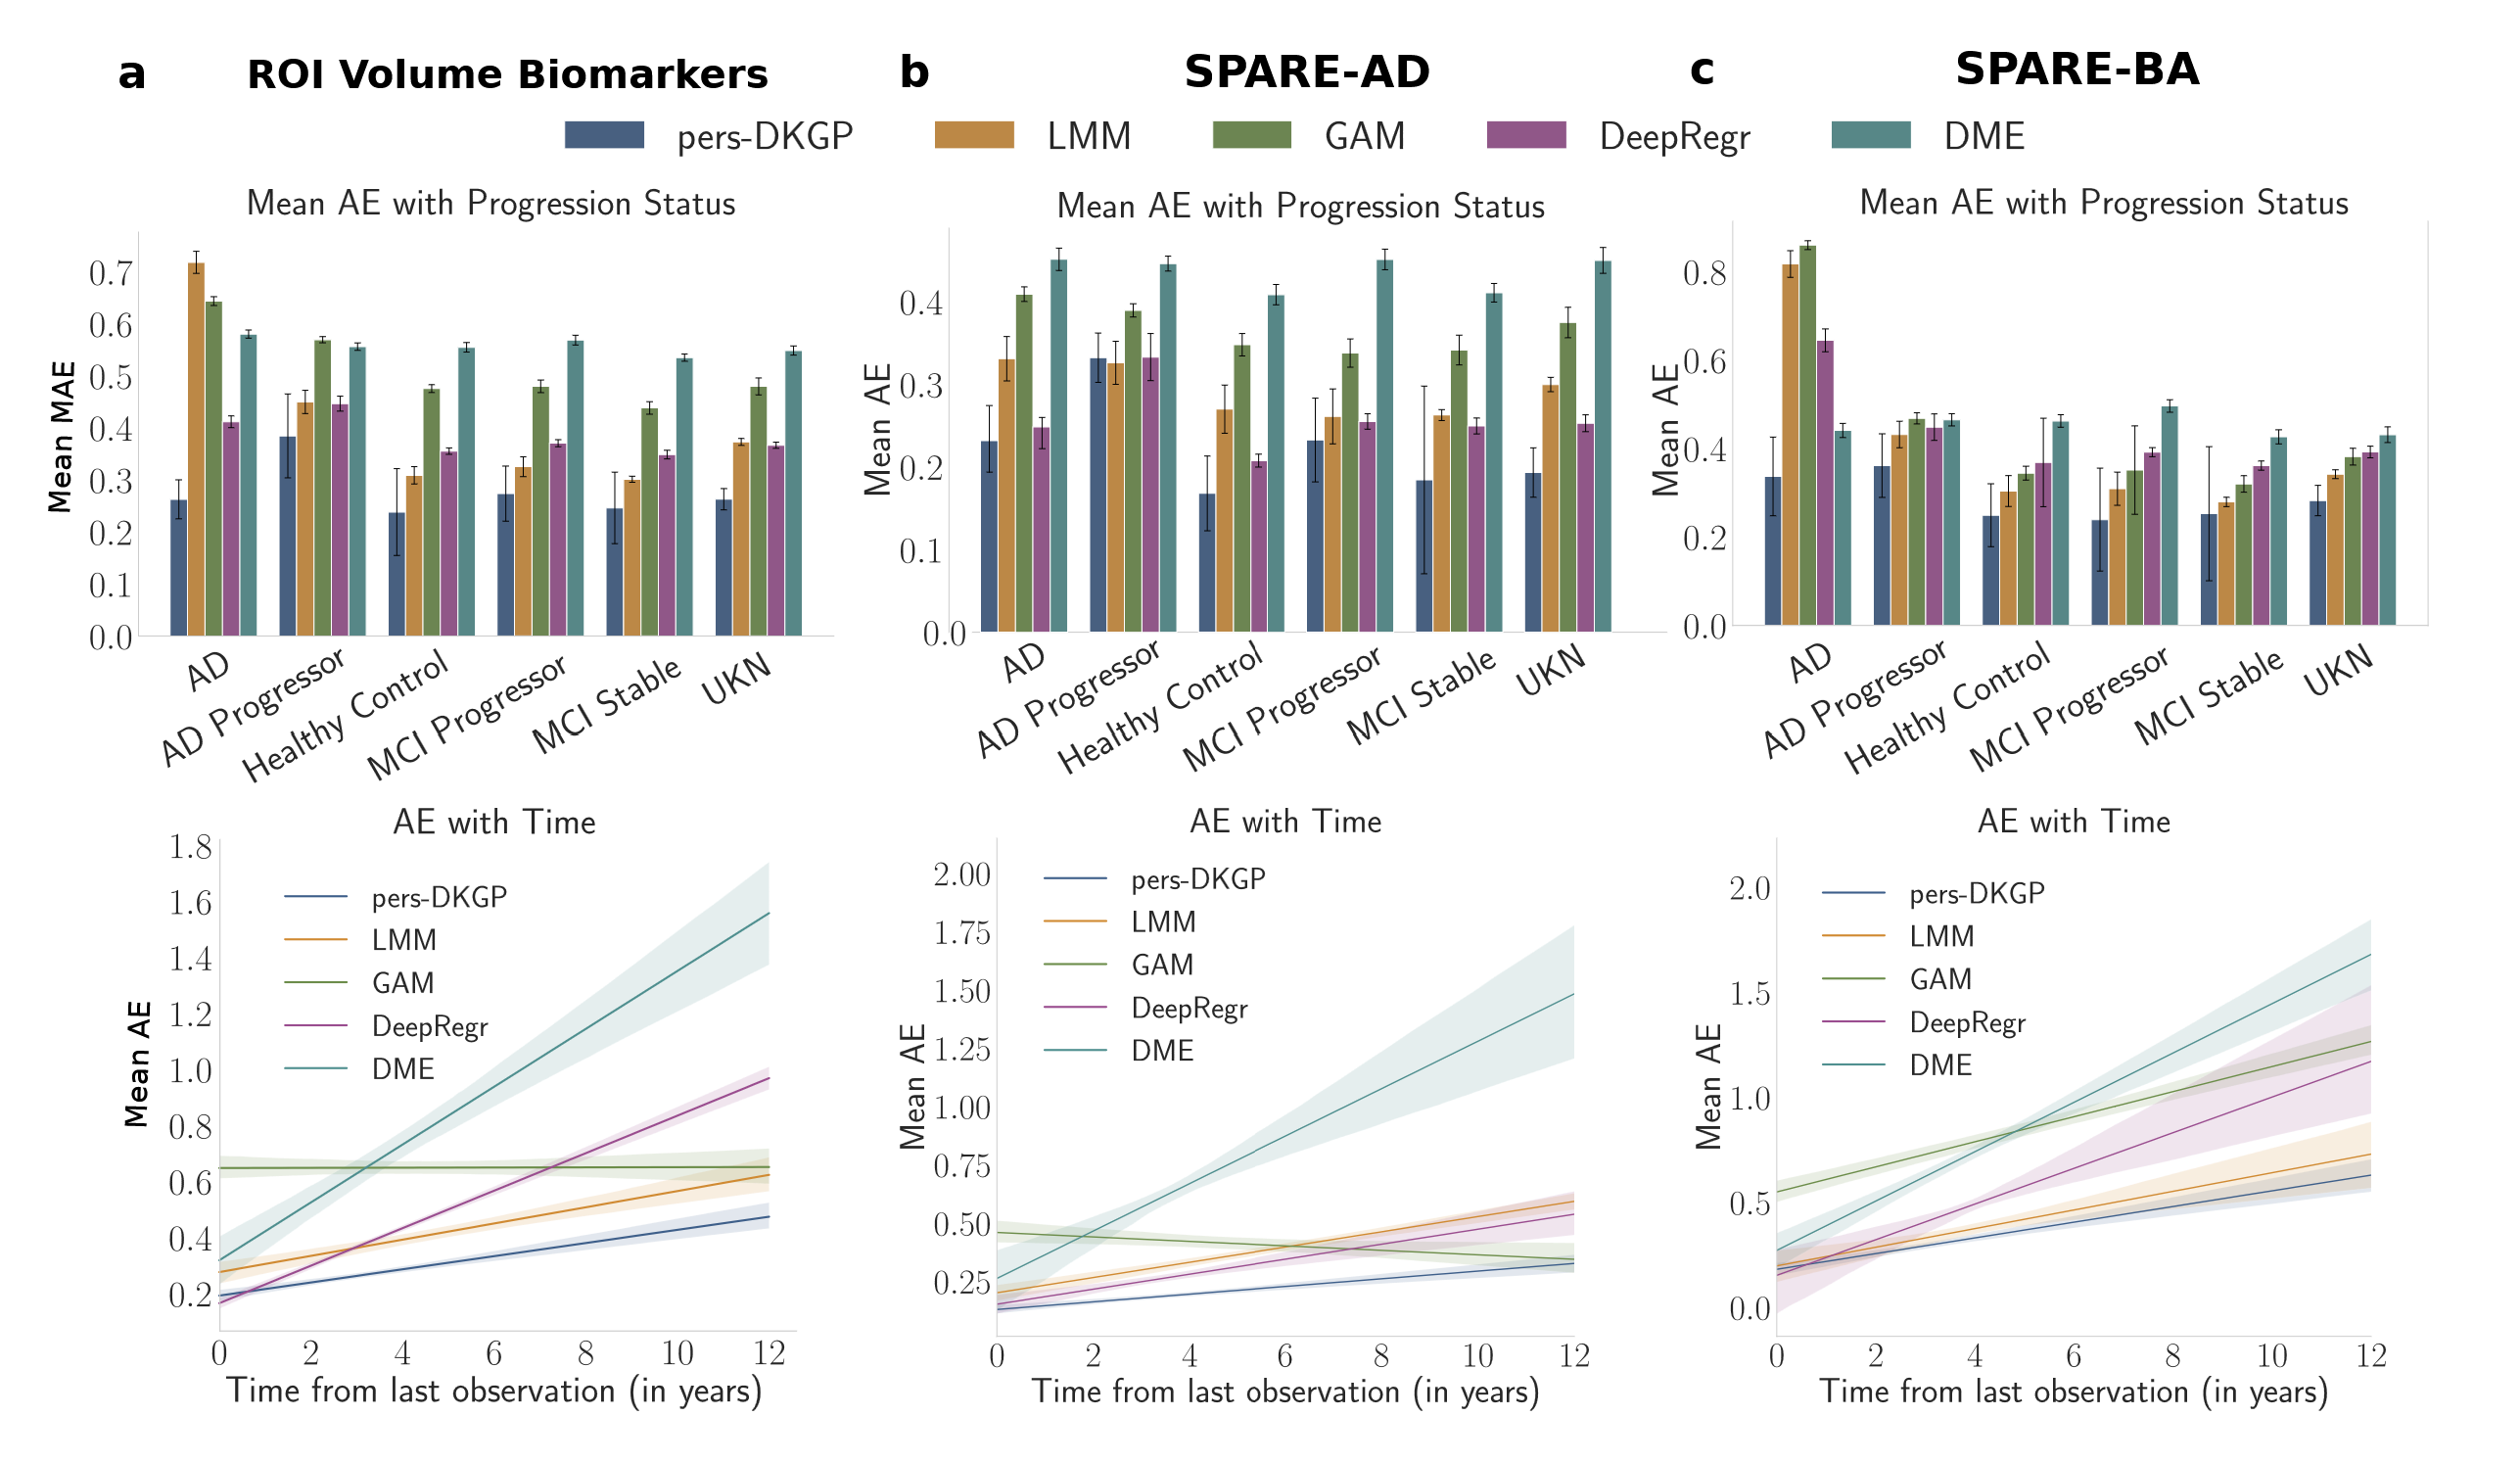 Figure: We compare the mean MAE per subject stratified by the progression status (top) and the AE with time from the last observation (bottom) of our method with the baselines for (a) the 7 ROI
Volume biomarkers, (b) SPARE-AD score and (c) SPARE-BA. Error bars, in the top row, denote the 95th percentile of the MAE across all subjects. Our method is denoted as pers-DKGP
Figure: We compare the mean MAE per subject stratified by the progression status (top) and the AE with time from the last observation (bottom) of our method with the baselines for (a) the 7 ROI
Volume biomarkers, (b) SPARE-AD score and (c) SPARE-BA. Error bars, in the top row, denote the 95th percentile of the MAE across all subjects. Our method is denoted as pers-DKGP
Qualitative Results: Biomarker Trajectories
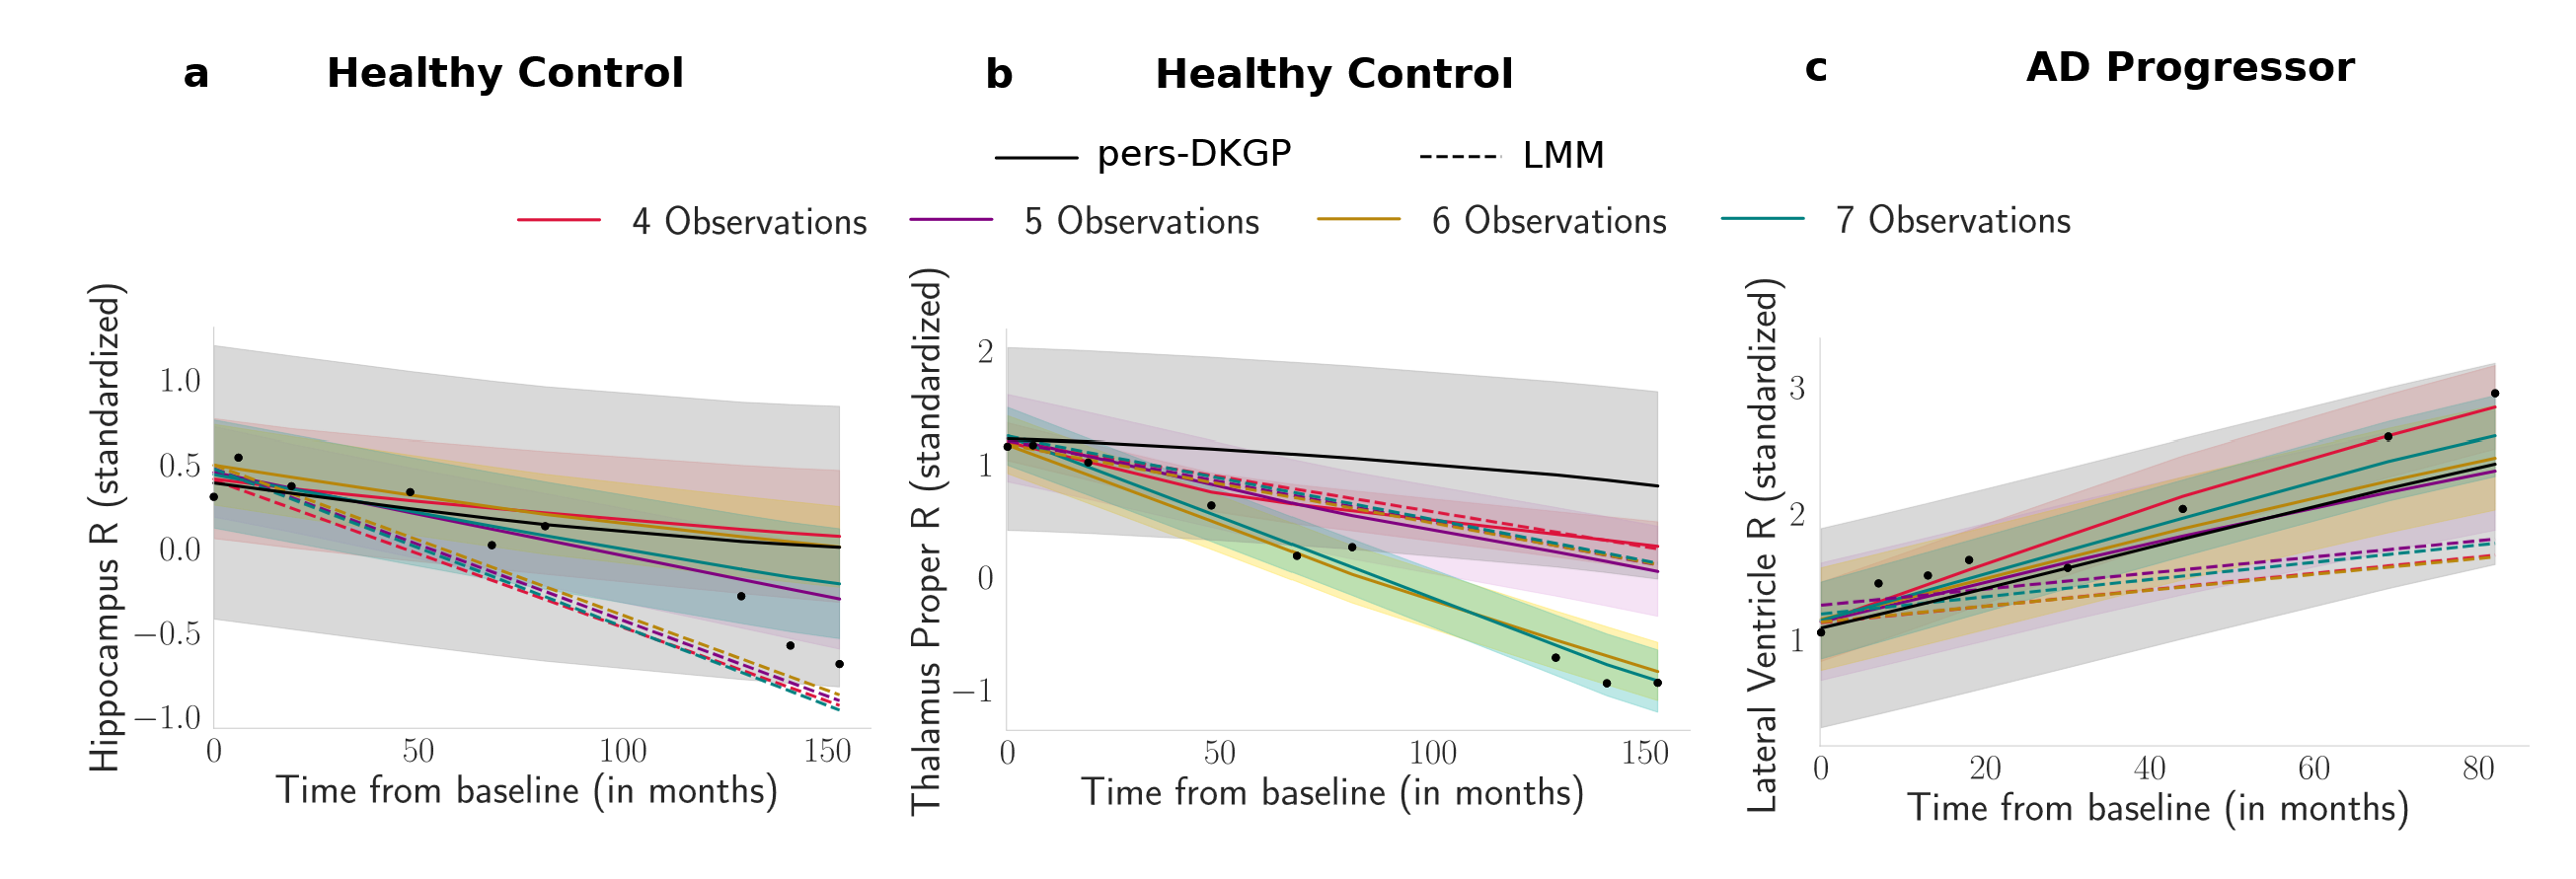 Figure: We present personalized ROI volume trajectories for three test subjects as observations increase from 4 to 7 acquisitions. The dashed lines represent the prediction using LMM. The first two panels visualize the Hippocampus R and Thalamus Proper R Volume trajectories of Healthy Control subject. Last panel shows the Lateral Ventricle R Volume for an AD Progressor. The shaded
bands represent the predictive uncertainty over time.
Figure: We present personalized ROI volume trajectories for three test subjects as observations increase from 4 to 7 acquisitions. The dashed lines represent the prediction using LMM. The first two panels visualize the Hippocampus R and Thalamus Proper R Volume trajectories of Healthy Control subject. Last panel shows the Lateral Ventricle R Volume for an AD Progressor. The shaded
bands represent the predictive uncertainty over time.
Why It Matters: Improved Forecasting and Clinical Relevance
Our method outperforms traditional models in predicting brain biomarker trajectories. We tested it on multiple neuroimaging studies, including Alzheimer's Disease Neuroimaging Initiative (ADNI) and Baltimore Longitudinal Study of Aging (BLSA), as well as independent external datasets. Results showed:- Higher predictive accuracy compared to state-of-the-art machine learning and statistical methods.
- Robust generalization across different neuroimaging cohorts, demonstrating clinical applicability.
- Disease progression modeling
- Clinical trial optimization
Citation
@inproceedings{tassopoulouadaptive,
title={Adaptive Shrinkage Estimation for Personalized Deep Kernel Regression in Modeling Brain Trajectories},
author={Tassopoulou, Vasiliki and Shou, Haochang and Davatzikos, Christos},
booktitle={The Thirteenth International Conference on Learning Representations}
}
title={Adaptive Shrinkage Estimation for Personalized Deep Kernel Regression in Modeling Brain Trajectories},
author={Tassopoulou, Vasiliki and Shou, Haochang and Davatzikos, Christos},
booktitle={The Thirteenth International Conference on Learning Representations}
}
References
Doshi, J., Erus, G., Ou, Y., Resnick, S.M., Gur, R.C., Gur, R.E., Satterthwaite, T.D., Furth, S., and Davatzikos, C. MUSE: MUlti-atlas region Segmentation utilizing Ensembles of registration algorithms and parameters, and locally optimal atlas selection. NeuroImage, 127:186–195, 2016. doi: 10.1016/j.neuroimage.2015.11.073
Habes, M., Pomponio, R., Shou, H., Doshi, J., Mamourian, E., Erus, G., Nasrallah, I., Launer, L.J., Rashid, T., Bilgel, M., et al. The Brain Chart of Aging: machine-learning analytics reveals links between brain aging, white matter disease, amyloid burden, and cognition in the iSTAGING consortium of 10,216 harmonized MR scans. Alzheimer's & Dementia, 17(1):89–102, 2021.
Powered by Jekyll and Minimal Light theme.