Uncertainty-Calibrated Prediction of Randomly-Timed Biomarker Trajectories with Conformal Bands

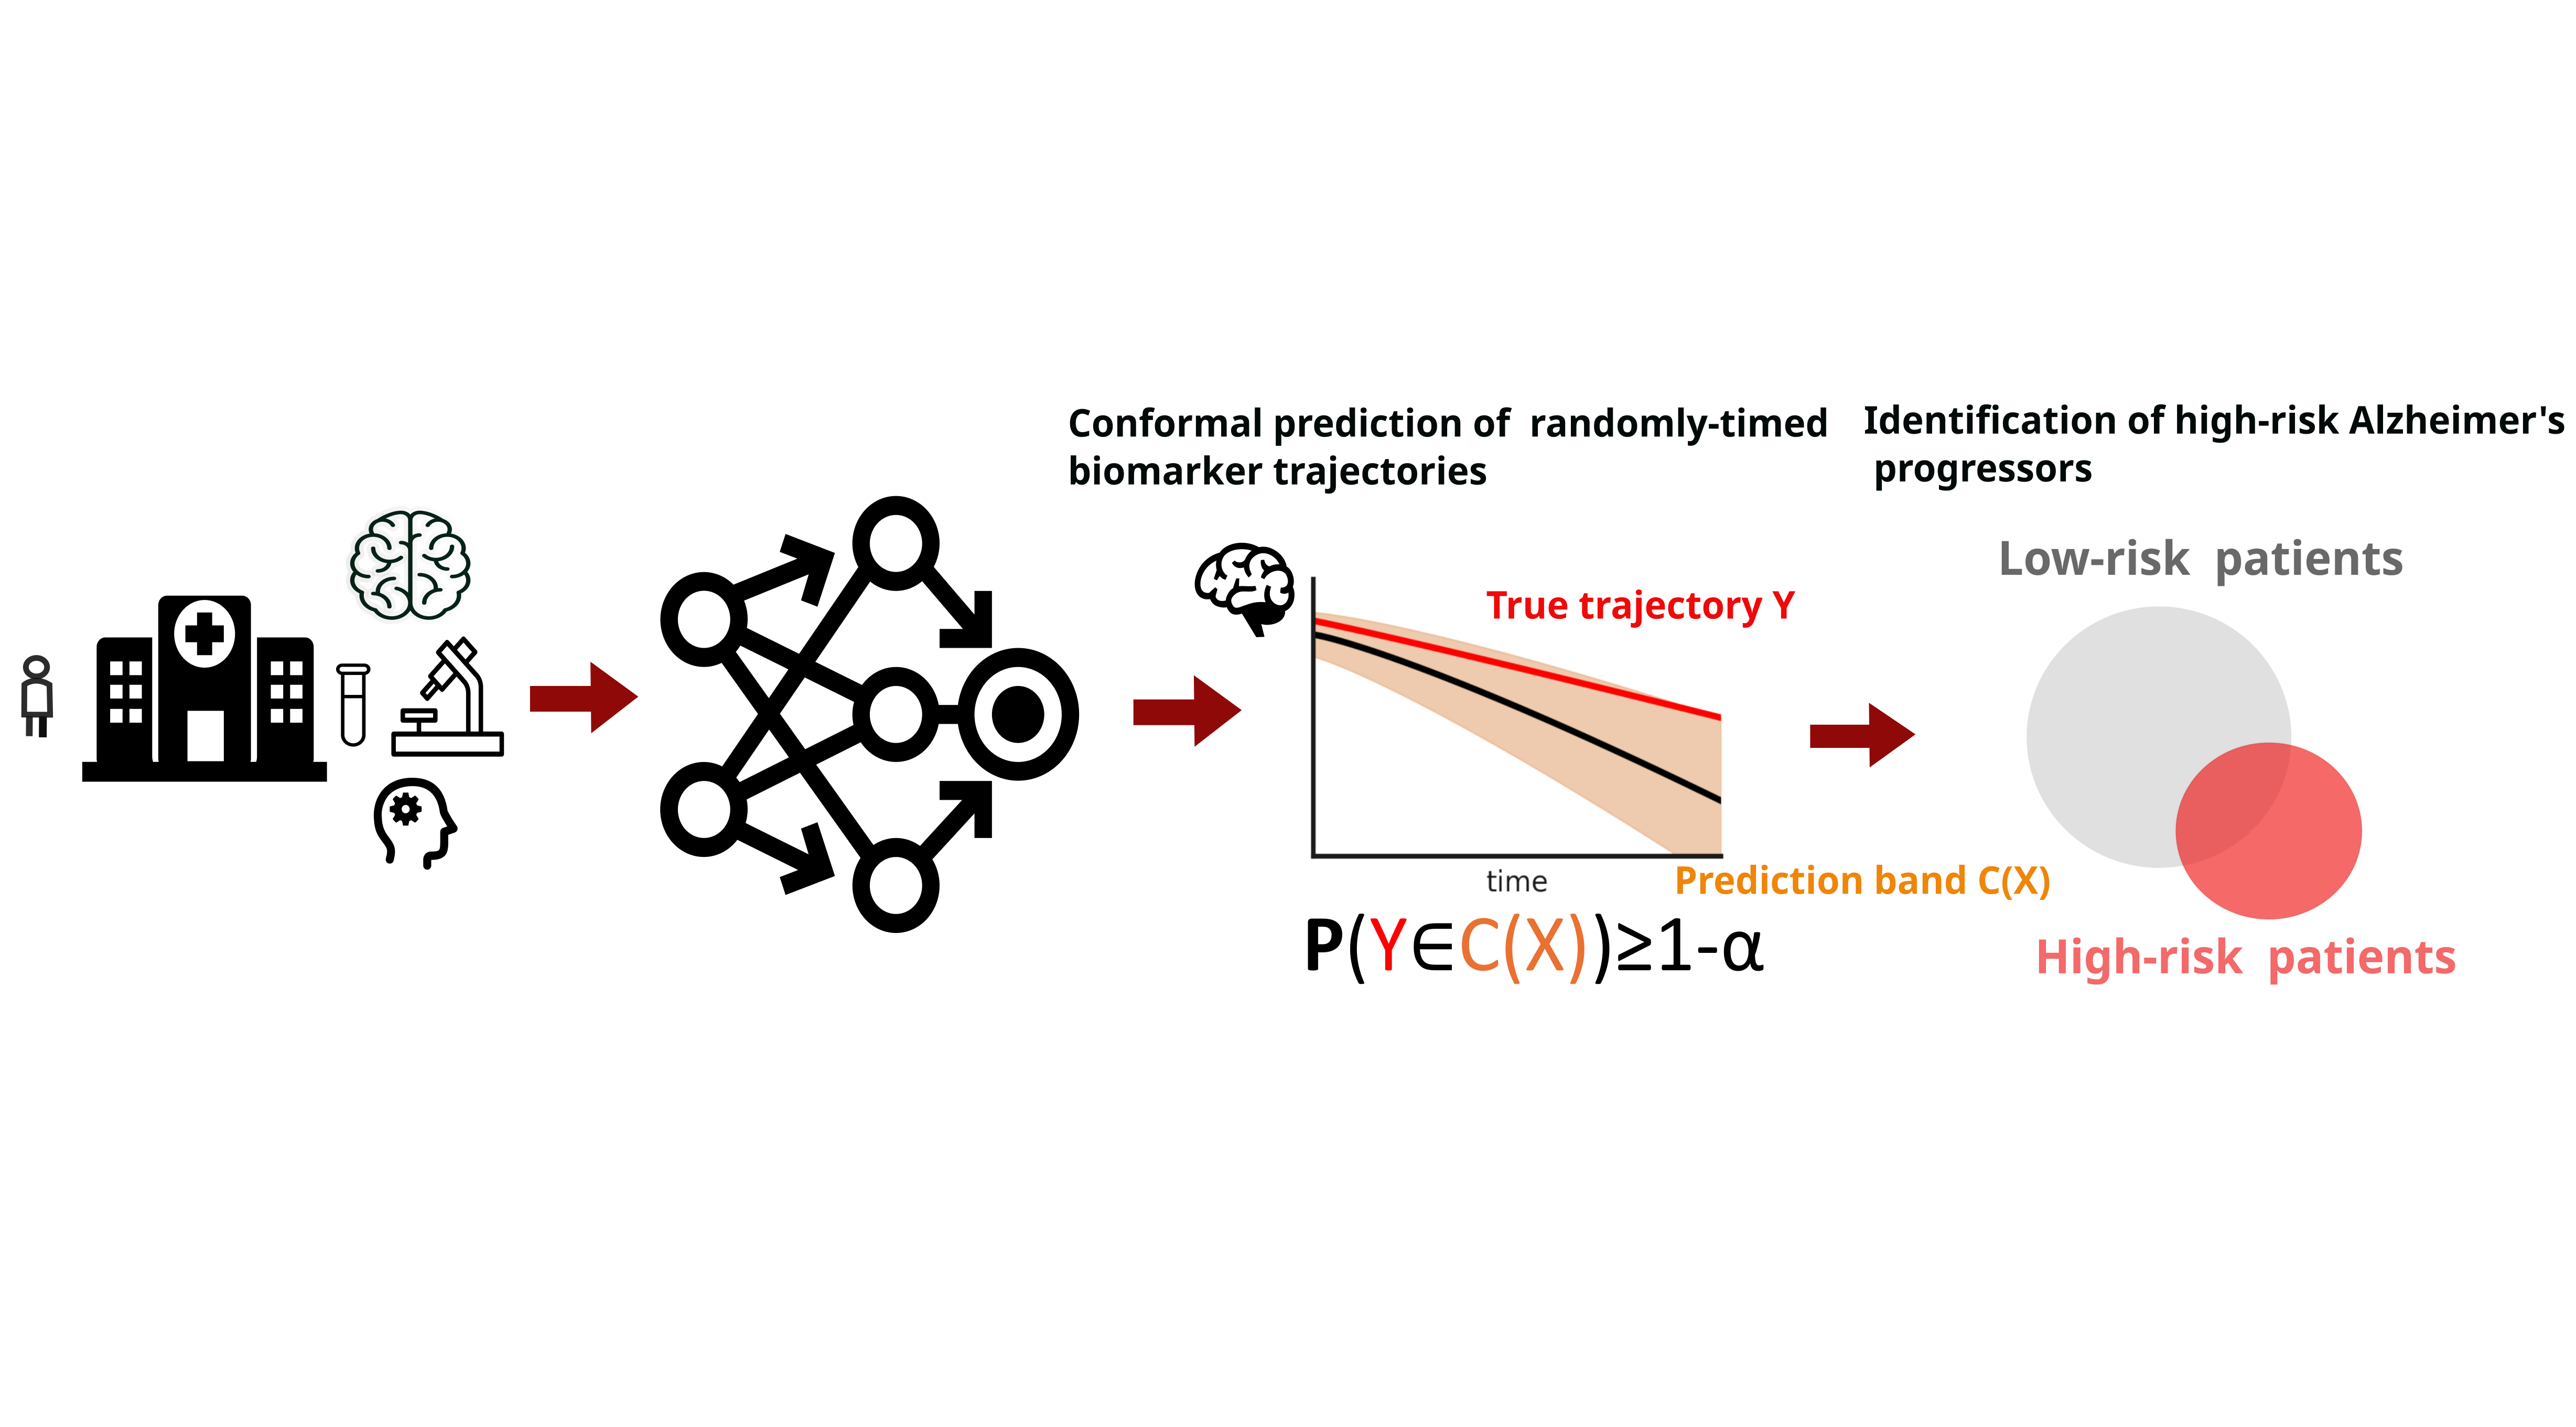 Figure 1: We design conformal prediction bands for randomly-timed biomarker trajectories. Using these bands, we develop an uncertainty-calibrated method of identifying high-risk Alzheimer's Disease progressors.
Abstract
Despite recent progress in predicting biomarker trajectories from real clinical data, uncertainty in the predictions poses high-stakes risks (e.g., misdiagnosis) that limit their clinical deployment. To enable safe and reliable use of such predictions in healthcare, we introduce a conformal method for uncertainty-calibrated prediction of biomarker trajectories resulting from randomly-timed clinical visits of patients. Our approach extends conformal prediction to the setting of randomly-timed trajectories via a novel nonconformity score that produces prediction bands guaranteed to cover the unknown biomarker trajectories with a user-prescribed probability. We apply our method across a wide range of standard and state-of-the-art predictors for two well-established brain biomarkers of Alzheimer's disease, using neuroimaging data from real clinical studies. We observe that our conformal prediction bands consistently achieve the desired coverage, while also being tighter than baseline prediction bands. To further account for population heterogeneity, we develop group-conditional conformal bands and test their coverage guarantees across various demographic and clinically relevant subpopulations. Moreover, we demonstrate the clinical utility of our conformal bands in identifying subjects at high risk of progression to Alzheimer’s disease. Specifically, we introduce an uncertainty-calibrated risk score that enables the identification of 17.5% more high-risk subjects compared to standard risk scores, highlighting the value of uncertainty calibration in real-world clinical decision making.Motivation and Problem Statement
Biomarker measurements are collected at random and patient-specific visit times, and are affected by measurement noise as well as disease hetegogeneity . These sources of variability make patient trajectories difficult to predict, often leading trajectory predictors to produce unreliable or inaccurate forecasts. Trajectory predictors (e.g., deep kernel GPs, Regression models) generate point forecasts or heuristic uncertainty estimates, but these are often miscalibrated—either too narrow (overconfident) or too wide (overly conservative). Miscalibrated uncertainty can obscure high-risk patients or mistakenly flag stable individuals. To enable trustworthy use in clinical care and risk stratification, we require uncertainty-calibrated prediction bands that remain valid for entire future trajectories .Problem Statement
We observe data from \(N\) subjects: \[ (X^{(1)}, Y^{(1)}, \mathcal{T}^{(1)}), \ldots, (X^{(N)}, Y^{(N)}, \mathcal{T}^{(N)}), \] where each subject has covariates \(X^{(i)}\), a biomarker trajectory \(Y^{(i)}\), and a randompy-timed set of observation times \(\mathcal{T}^{(i)}\). The data distribution is arbitrary and may include heterogeneity, noise, and irregular timing. A trajectory predictor (e.g., DKGP, Regression model) produces predicted trajectories: \[ \widehat{Y}^{(1)}, \ldots, \widehat{Y}^{(N)}. \] Our goal is to construct distribution-free, uncertainty-calibrated prediction bands \(C_t(X)\) such that for a new subject with data \(X\), \[ \mathbb{P}\big( Y_t \in C_t(X) \;\; \forall t \in \mathcal{T} \big) \ge 1 - \alpha, \] where \(C_t(X)\) may be built from any predictor, regardless of its underlying assumptions. This framework must:- Accommodate arbitrary data distributions
- Work with arbitrary trajectory predictors
Contributions
- We introduce a new conformal prediction framework for randomly-timed biomarker trajectories .
- To address population heterogeneity, we propose group-conditional conformal prediction with formal group-specific coverage guarantees.
- We introduce an uncertainty-calibrated method, the Rate of Change Bound, that identifies 17.5% more high-risk MCI patients who progress to Alzheimer’s Disease compared to standard methods.
Conformal Prediction for Randomly-Timed Trajectories
To address the randomly-timed measurements within a biomarker trajectory, we compute a trajectory-wide nonconformity score that measures the normalized absolute error between the observed and predicted trajectory for each subject \(i\). The score is defined as:
\[ R^{(i)} = \max_{t \in T^{(i)}} \frac{\left|\, Y^{(i)}_{t} - \hat{Y}^{(i)}_{t} \,\right|} {\sigma\!\left(\hat{Y}^{(i)}_{t}\right)}. \]
Here, \(T(i)\) denotes the subject-specific set of observed visit times. For each timepoint, we compute the standardized absolute error between the true measurement \(Y^{(i)}_t\) and the model prediction \(\hat{Y}^{(i)}_t\), normalized by the model’s predictive uncertainty \(\sigma(\hat{Y}^{(i)}_t)\). Taking the maximum across all timepoints ensures that the resulting conformal prediction bands provide simultaneous coverage over the entire future trajectory.
Figure 2 provides an overview of our conformal prediction framework for biomarker trajectory forecasting. The base model is first trained on the dataset \(D_{\text{train}}\), after which we use a separate calibration set \(D_{\text{cal}}\) to compute trajectory-wide nonconformity scores for each subject. These scores determine the quantiles used to construct time-varying conformal prediction intervals, denoted by \(C_t(X)\).
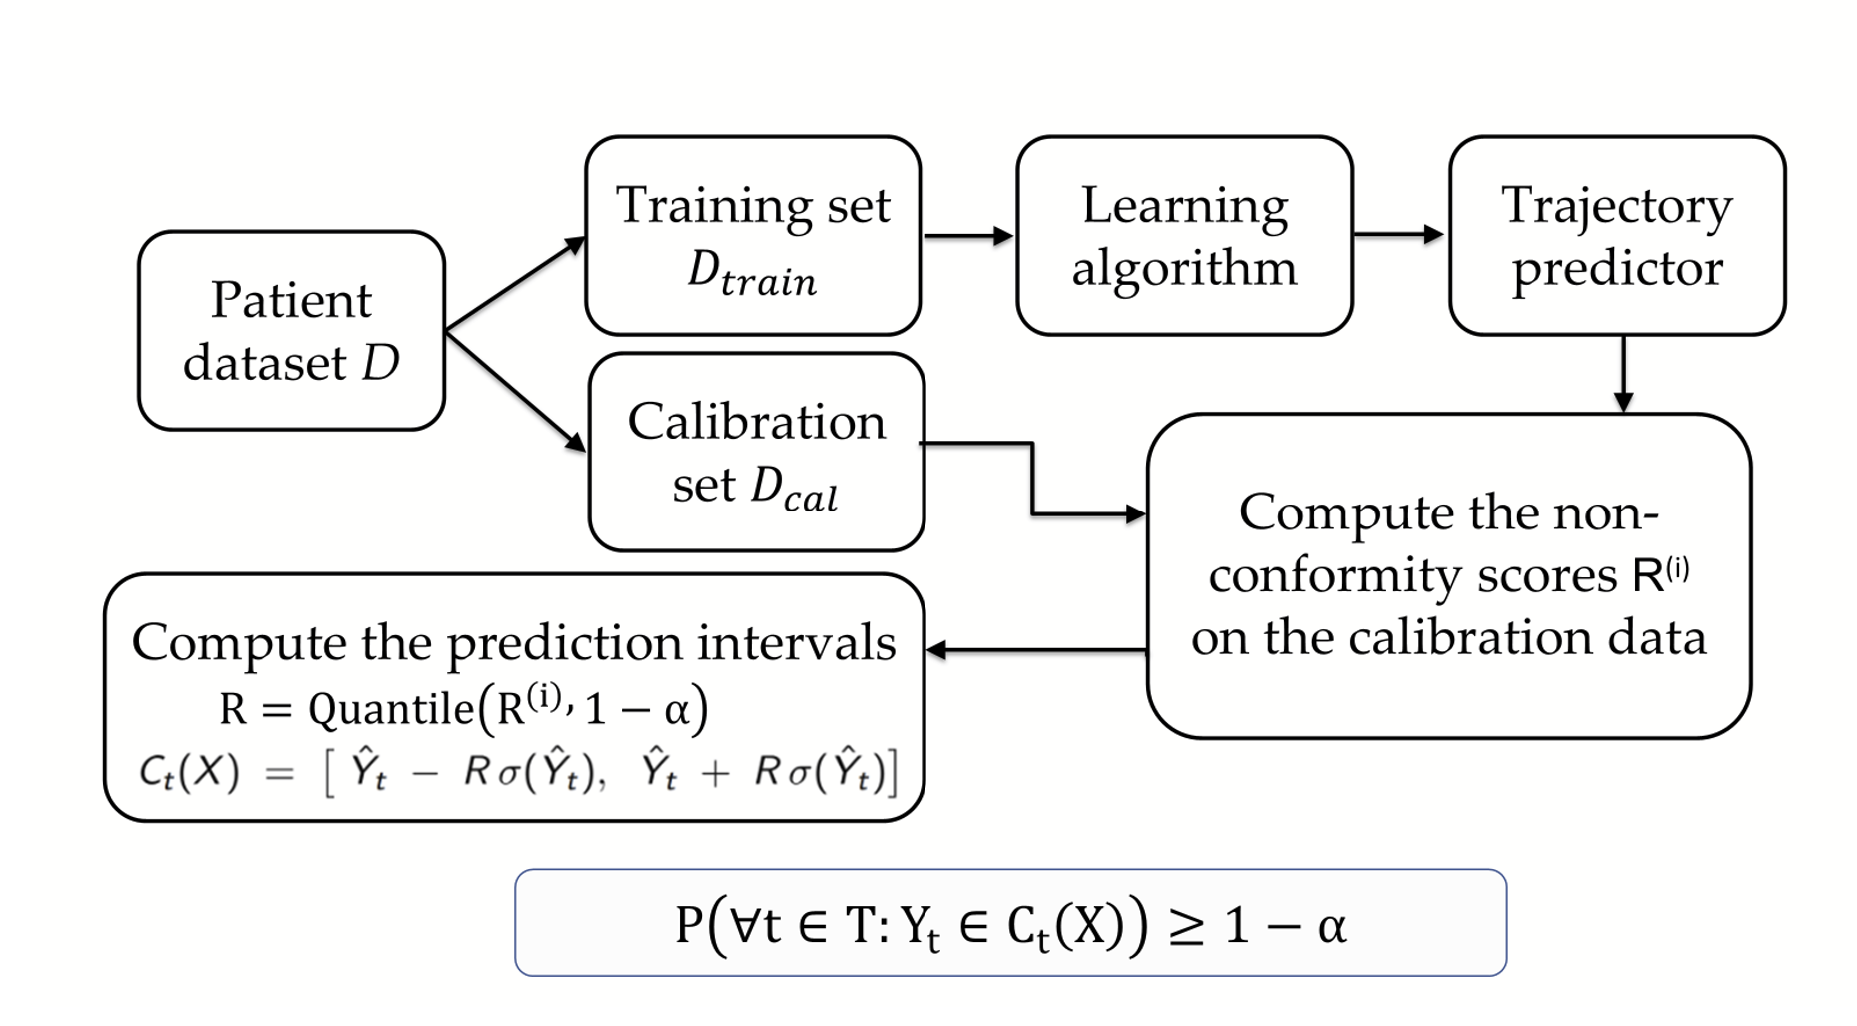 Figure 2. Overview of our conformalization framework for biomarker trajectory prediction. The model is trained on \(D_{\text{train}}\) and calibrated on \(D_{\text{cal}}\), where calibration non-conformity scores are computed and used to form time-varying prediction intervals \(C_t(X)\). These conformal bands provide valid uncertainty guarantees across all future timepoints, ensuring \(\mathbb{P}(Y_t \in C_t(X)\ \forall t) \ge 1-\alpha\).
Conformal Prediction for Brain Biomarkers
We evaluate our conformal prediction framework on two established neurodegenerative biomarkers: hippocampal volume and ventricular volume. Each biomarker dataset contains approximately 2,200 subjects with irregularly sampled longitudinal trajectories. The data come from clinical studies extracted from iSTAGING Consortium [1]. We conformalize a broad set of baseline and state-of-the-art predictors, including: Deep Kernel Gaussian Process (DKGP) [2], Deep Mixed Effects (DME) [3], Deep Quantile Regression (DQR), Bootstrap Deep Regression, and Deep Regression with Monte Carlo Dropout (DRMC). This allows us to assess calibration quality and interval efficiency across diverse model classes.
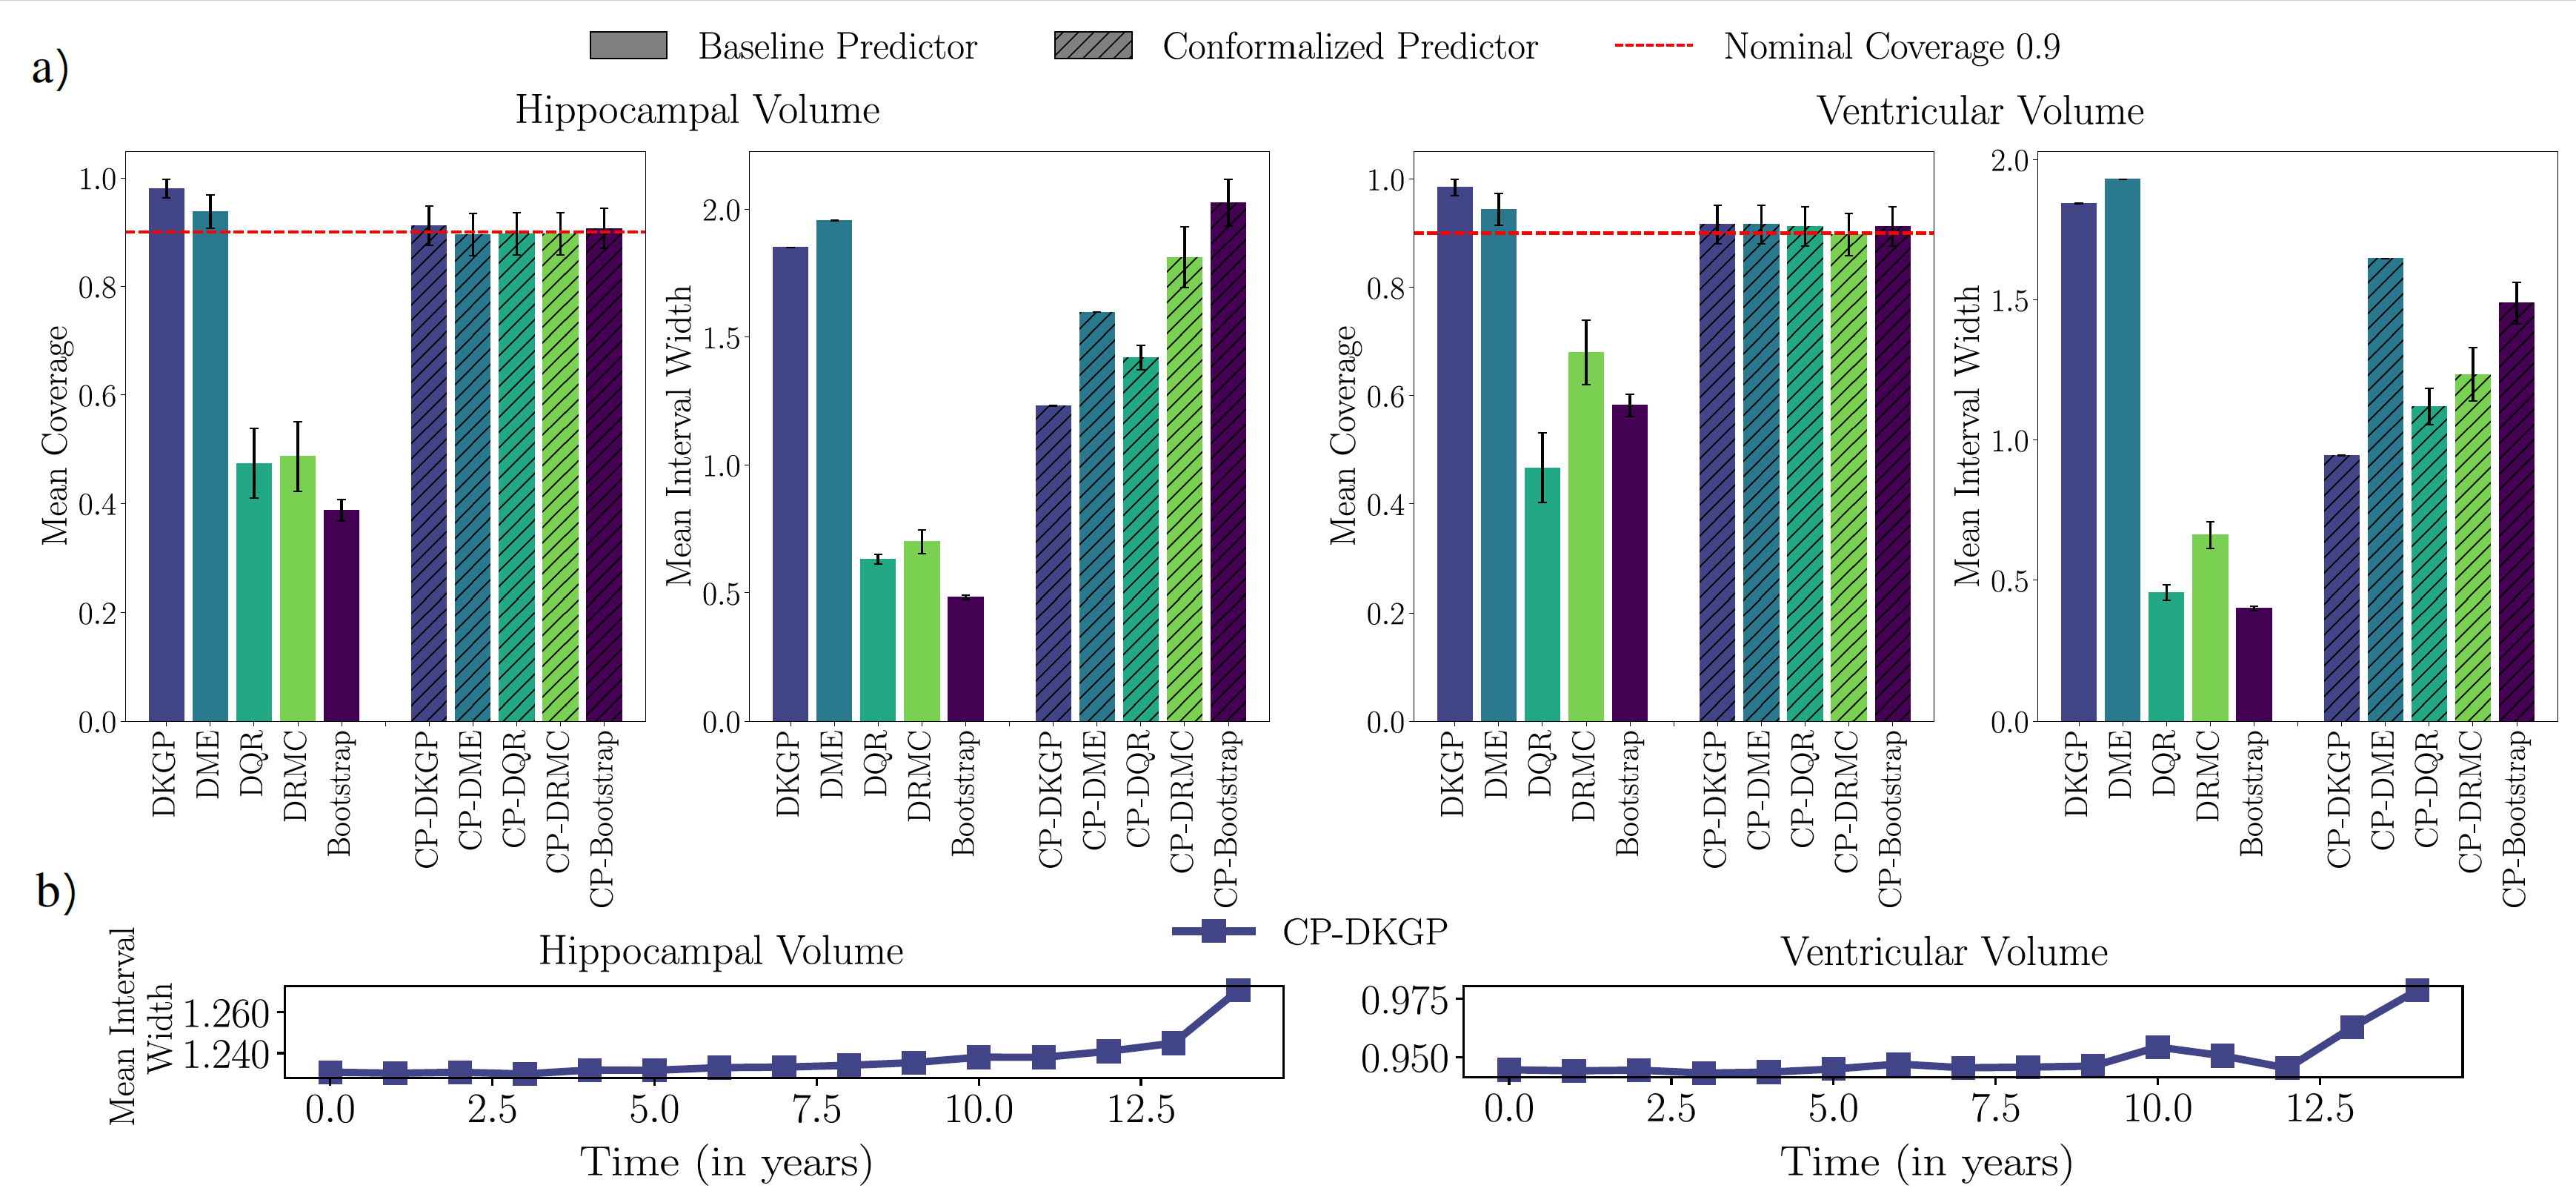 Figure 3: (a) Mean coverage and interval width for baseline vs. conformalized predictors
on hippocampal- and ventricular-volume trajectories. Baseline models vary widely in
coverage, while all conformalized predictors achieve the target level with competitive
interval width. (b) Temporal evolution of the 90% CP-DKGP interval width, which remains
tight early in time and widens gradually with the prediction horizon as uncertainty grows.
Figure 3: (a) Mean coverage and interval width for baseline vs. conformalized predictors
on hippocampal- and ventricular-volume trajectories. Baseline models vary widely in
coverage, while all conformalized predictors achieve the target level with competitive
interval width. (b) Temporal evolution of the 90% CP-DKGP interval width, which remains
tight early in time and widens gradually with the prediction horizon as uncertainty grows.
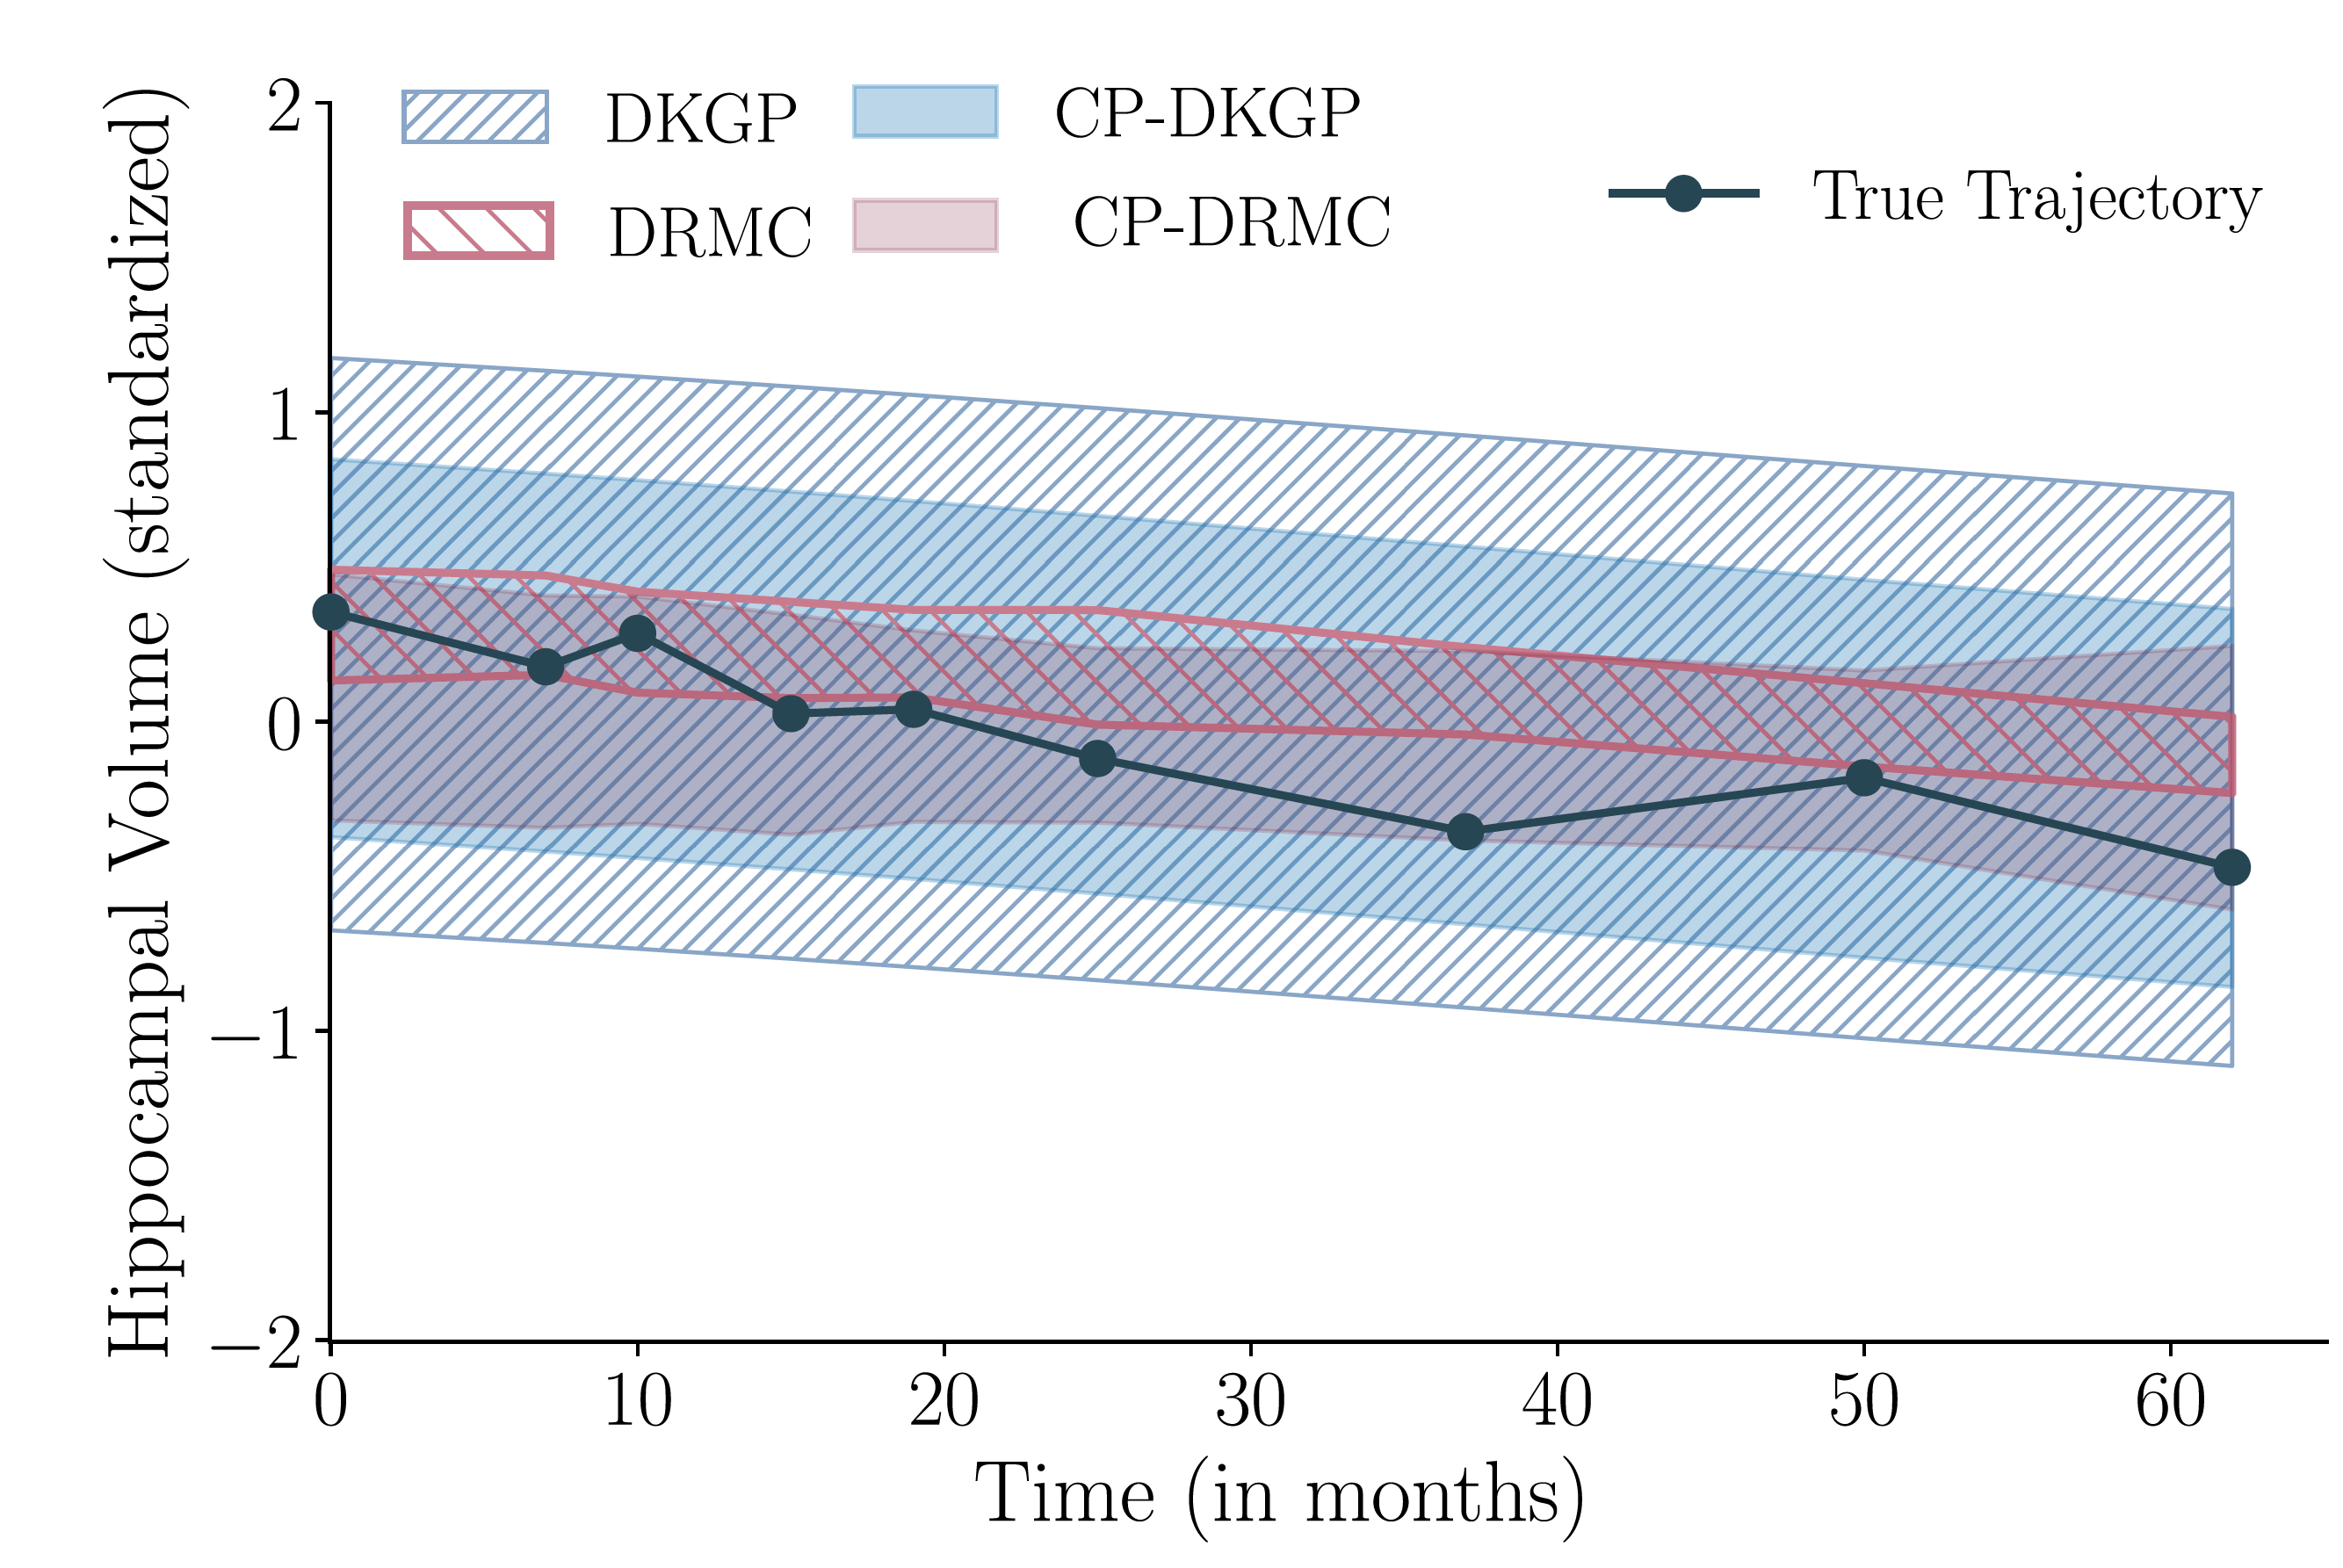 Figure 4: Qualitative comparison of prediction bands before and after conformal calibration.
DKGP produces overly wide bounds, while DRMC is overconfident and misses later observations.
After conformalization, CP-DKGP and CP-DRMC adjust their bands to achieve the desired
coverage, correcting both over- and under-confidence.
Figure 4: Qualitative comparison of prediction bands before and after conformal calibration.
DKGP produces overly wide bounds, while DRMC is overconfident and misses later observations.
After conformalization, CP-DKGP and CP-DRMC adjust their bands to achieve the desired
coverage, correcting both over- and under-confidence.
Group-Conditional Conformal Prediction
To obtain subgroup-level uncertainty guarantees, we stratify the calibration data by key demographic and clinical covariates—such as age, sex, race, and diagnosis—and then apply our conformal prediction procedure within each group separately. This group-conditional calibration produces prediction bands that are tailored to each subgroup and provide formal coverage guarantees at the group level.
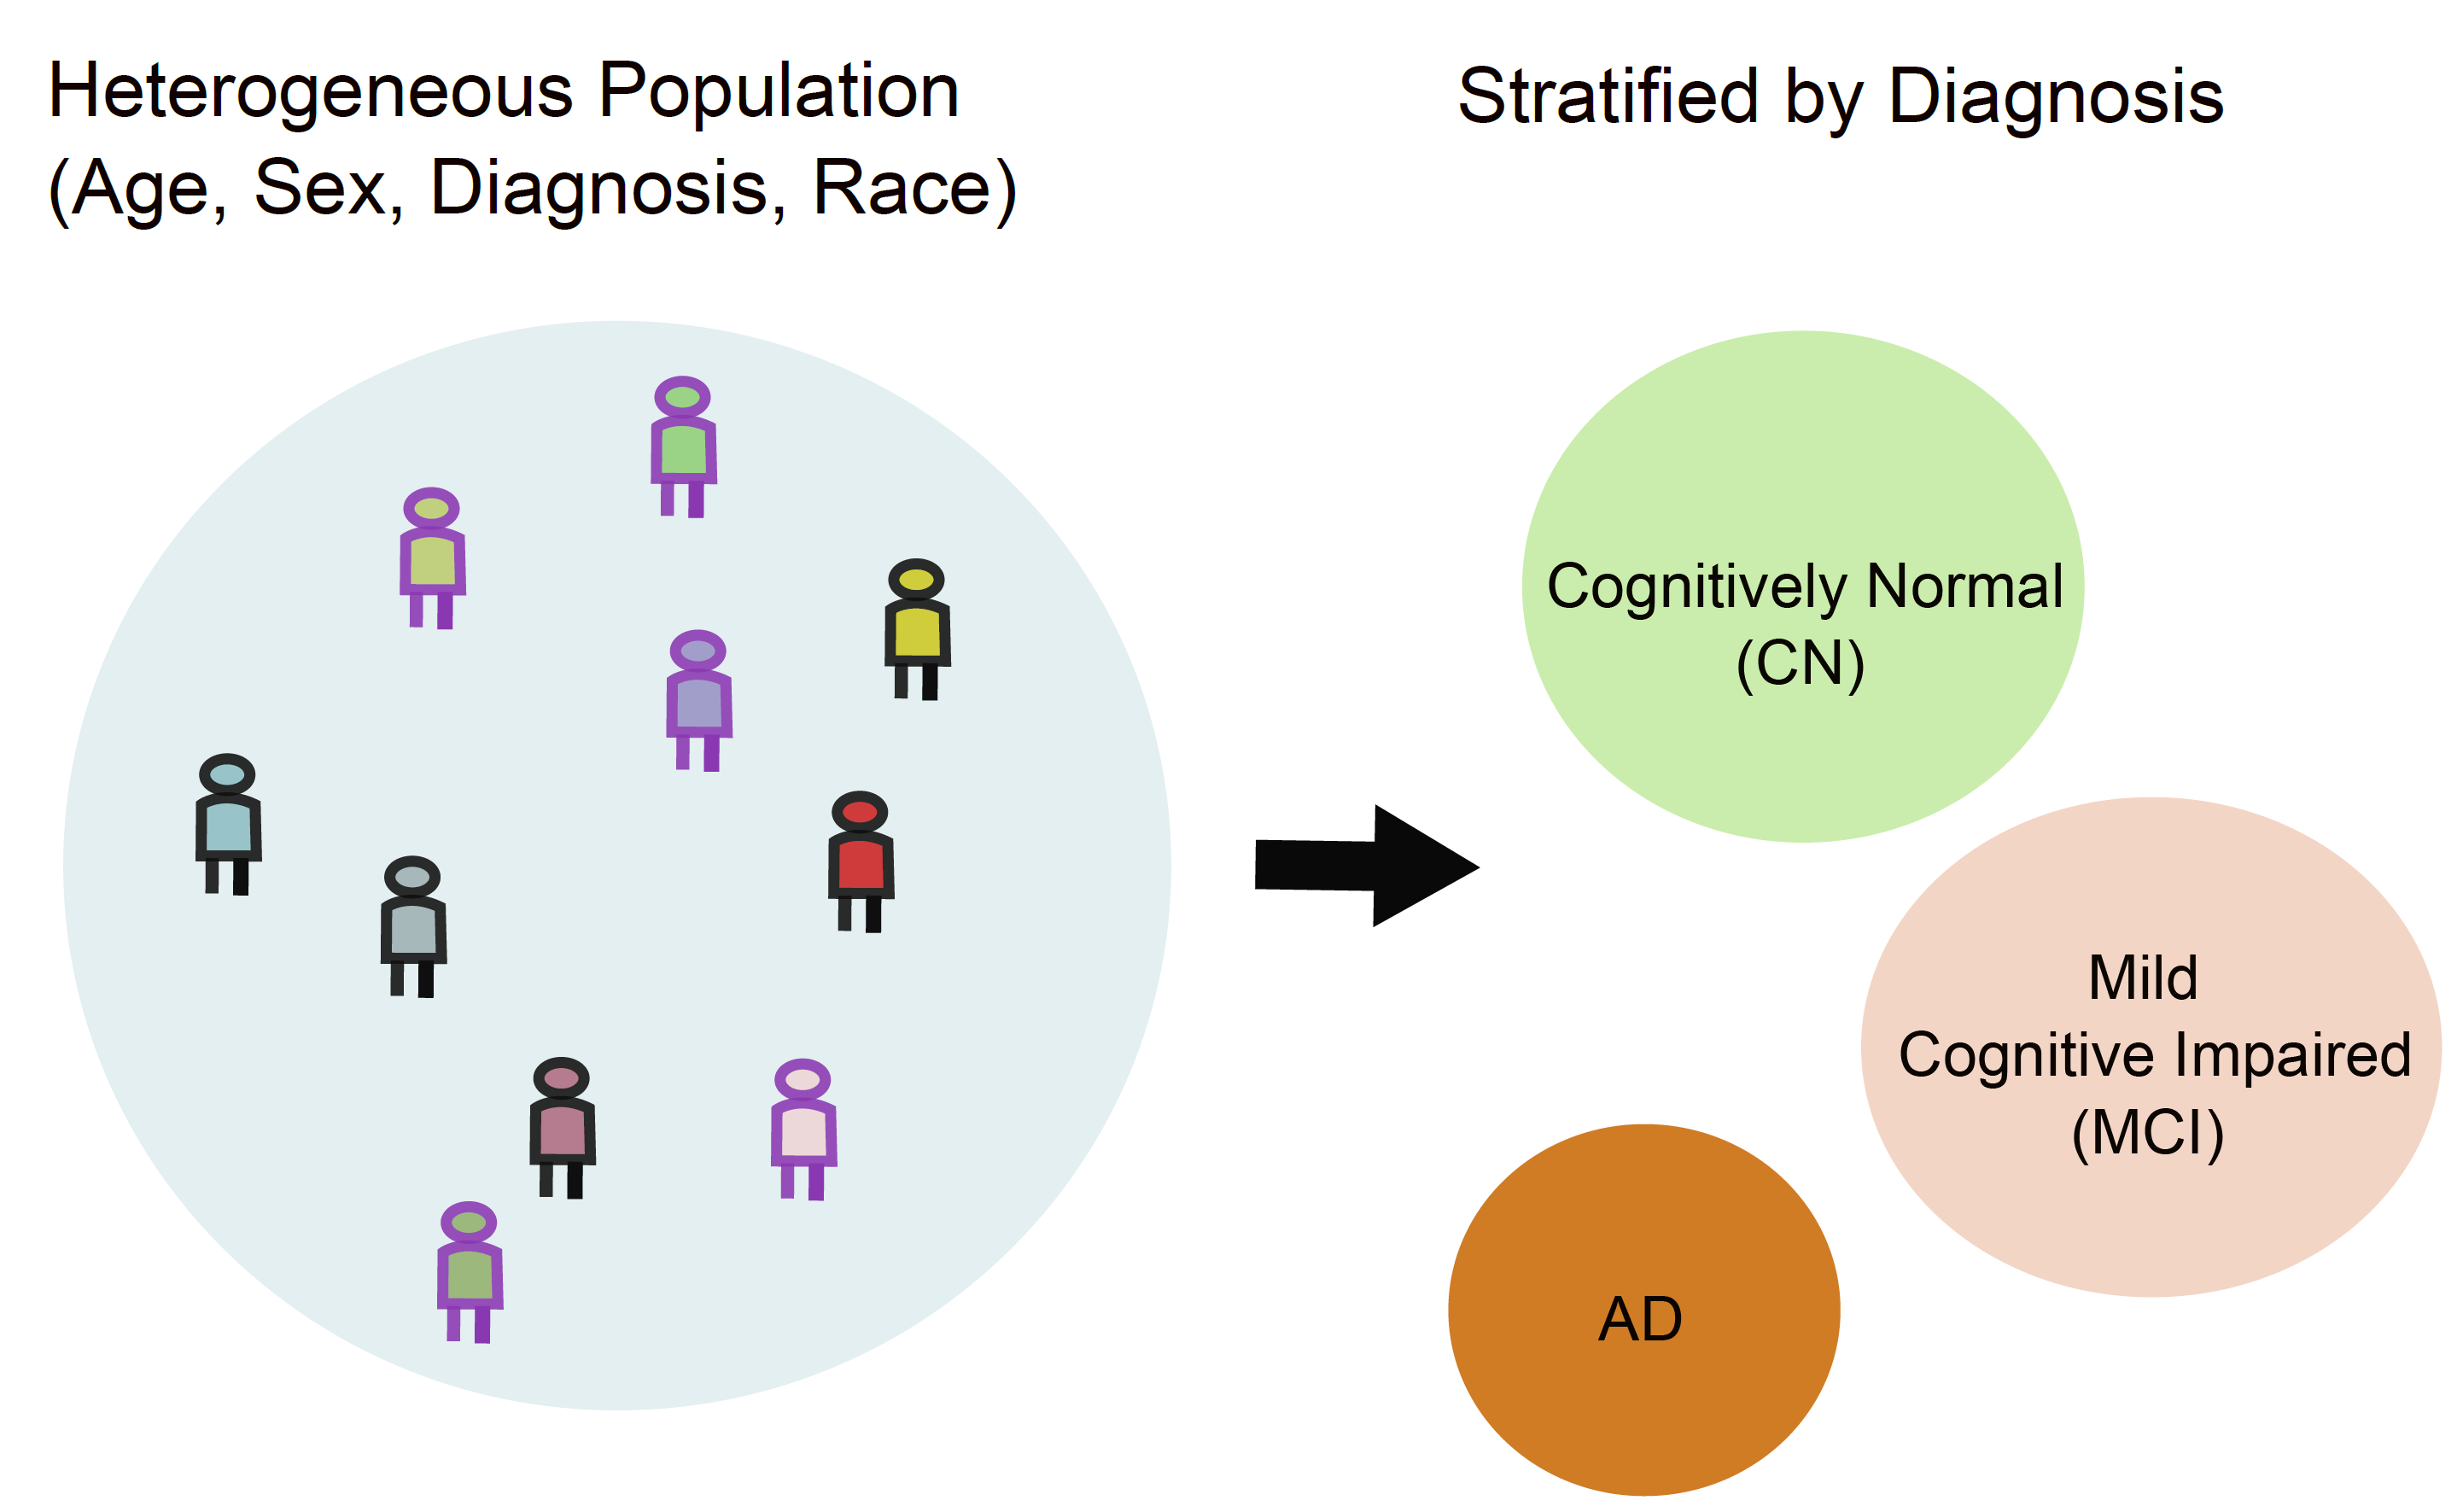 Figure 5: Illustration of group-conditional conformal prediction. A heterogeneous population
with variation in age, sex, diagnosis, and race is stratified into clinically meaningful
subgroups (e.g., CN, MCI, AD). Calibrating uncertainty within each subgroup enables
group-specific coverage guarantees and improves fairness and reliability across diverse populations.
Figure 5: Illustration of group-conditional conformal prediction. A heterogeneous population
with variation in age, sex, diagnosis, and race is stratified into clinically meaningful
subgroups (e.g., CN, MCI, AD). Calibrating uncertainty within each subgroup enables
group-specific coverage guarantees and improves fairness and reliability across diverse populations.
For diagnosis-based stratification, group-conditional calibration guarantees that each subgroup receives its own valid uncertainty level. Formally, the conformal prediction sets satisfy:
\[ \mathbb{P}\!\left( Y \in C(X) \mid \text{Group}(X) = \text{CN} \right) \ge 1 - \alpha, \] \[ \mathbb{P}\!\left( Y \in C(X) \mid \text{Group}(X) = \text{MCI} \right) \ge 1 - \alpha, \] \[ \mathbb{P}\!\left( Y \in C(X) \mid \text{Group}(X) = \text{AD} \right) \ge 1 - \alpha. \]
These guarantees ensure that cognitively normal, mildly impaired, and Alzheimer’s subjects each receive prediction intervals calibrated to their subgroup.
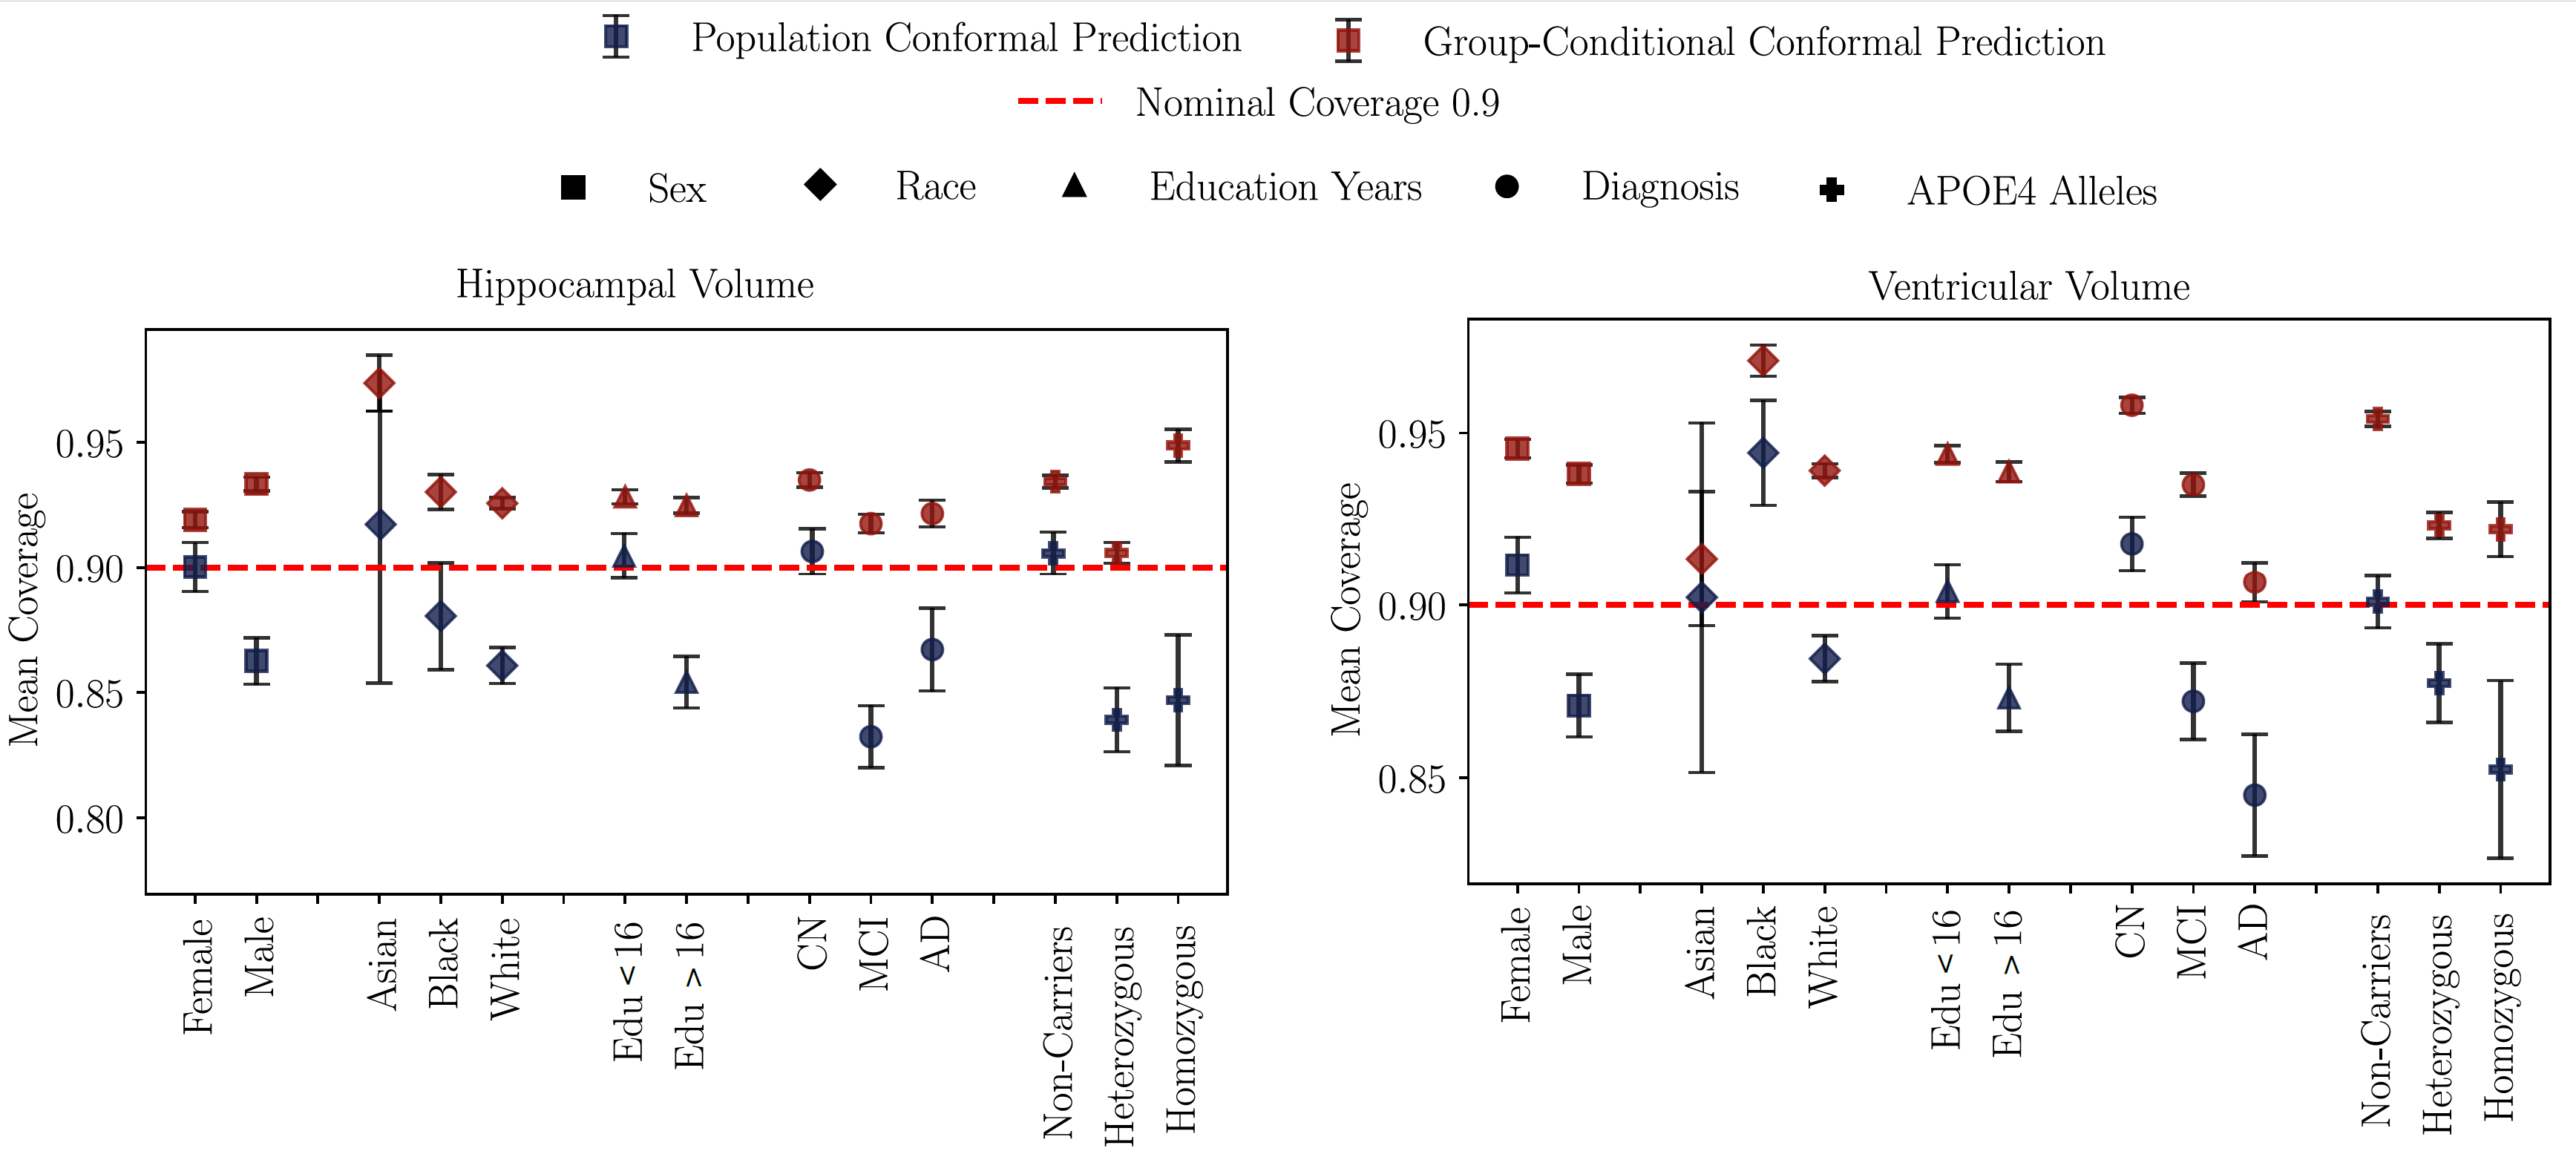 Figure 6: Mean coverage for population vs. group-conditional conformal prediction
across demographic and clinical subgroups. Population-level conformalization often
misses the target coverage, while group-conditional calibration consistently meets
the desired confidence level across all stratifications.
Figure 6: Mean coverage for population vs. group-conditional conformal prediction
across demographic and clinical subgroups. Population-level conformalization often
misses the target coverage, while group-conditional calibration consistently meets
the desired confidence level across all stratifications.
Uncertainty-Calibrated Identification of High-Risk Subjects
A key clinical question is how quickly a biomarker is changing for an individual patient. Standard approaches estimate a single rate of change using the model’s point predictions, but these estimates can be overly optimistic or misleading when uncertainty is high—especially for patients with sparse or irregular follow-up. To address this, we introduce the Rate-of-Change Bound (RoCB) , an uncertainty-aware progression metric derived from our conformal prediction bands. RoCB provides a conservative estimate of how rapidly a biomarker could be worsening while still remaining compatible with the model-calibrated uncertainty. For a subject \(i\) with baseline time \(t_0\) and final follow-up time \(t_N\), the model’s predicted rate of change is: \[ \widehat{\mathrm{RoC}}^{(i)} = \frac{\widehat{Y}^{(i)}_{t_N} - Y^{(i)}_{t_0}}{t_N - t_0}. \] This uses only the prediction, ignoring uncertainty. Our conformal method produces calibrated prediction bands \((L_t^{(i)}, U_t^{(i)})\) that satisfy \[ \mathbb{P}\big(Y_t^{(i)} \in [L_t^{(i)}, U_t^{(i)}] \;\forall t\big) \ge 1-\alpha. \] These bands guarantee coverage over all future timepoints , enabling a principled way to incorporate uncertainty into progression metrics. \[ \operatorname{RoCB}^{(i)} = \begin{cases} \displaystyle \frac{L^{(i)}_{t_{N}} - Y^{(i)}_{t_{0}}}{t_{N} - t_{0}}, & \text{if biomarker decreases with progression}, \\[1.2em] \displaystyle \frac{U^{(i)}_{t_{N}} - Y^{(i)}_{t_{0}}}{t_{N} - t_{0}}, & \text{if biomarker increases with progression}. \end{cases} \] The lower-bound slope captures the fastest plausible decline consistent with the uncertainty bands, providing a conservative indicator of neurodegeneration.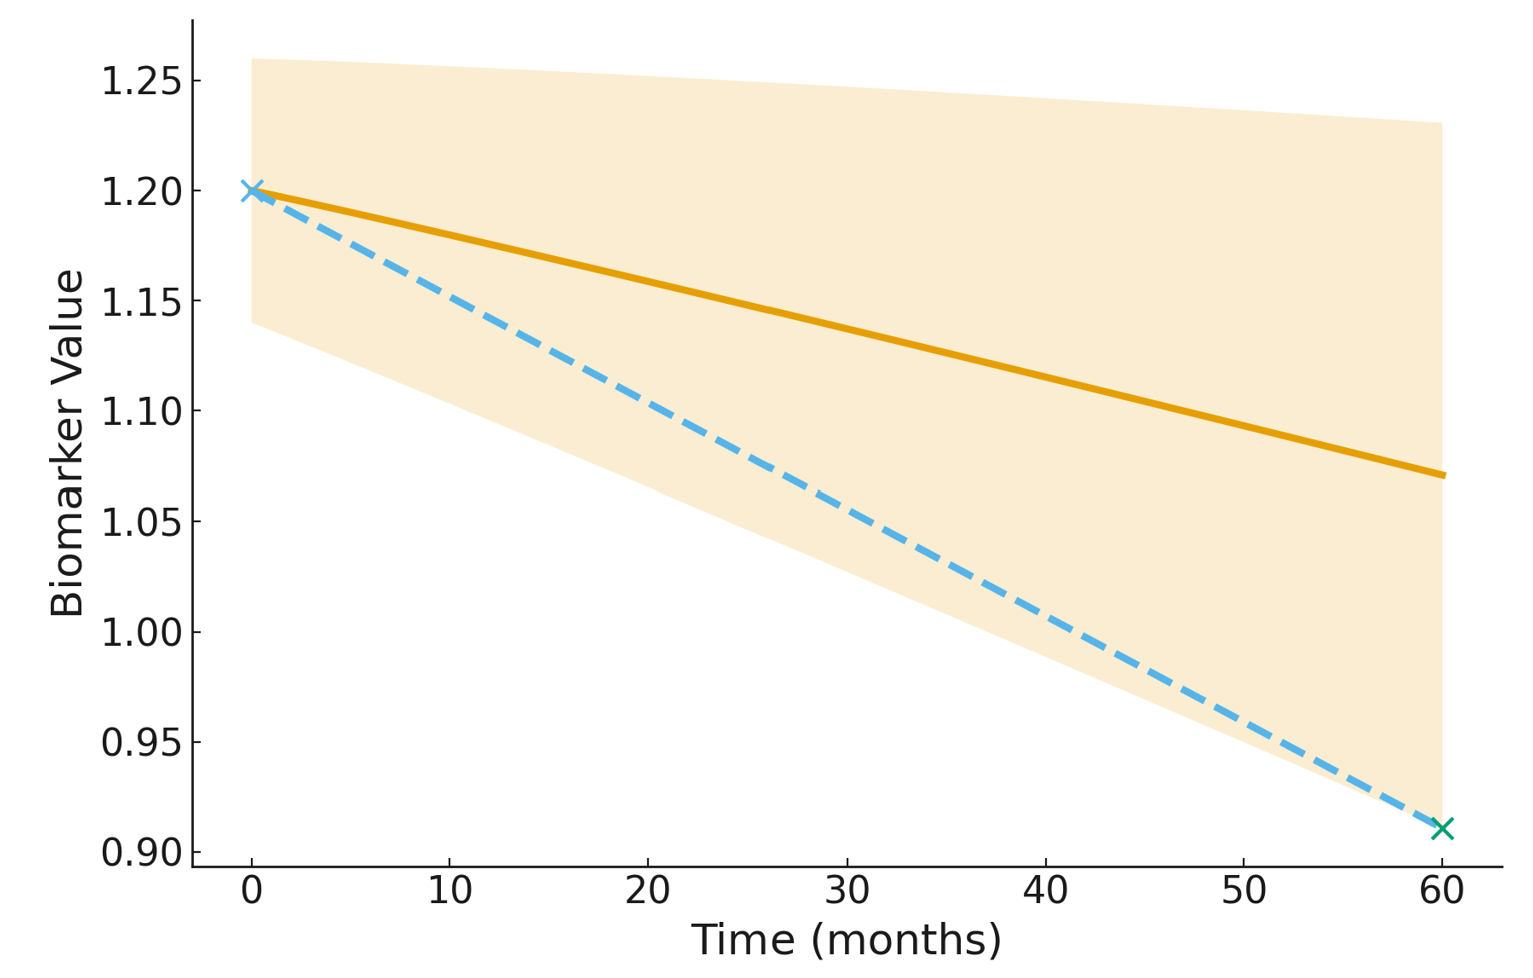 Figure 7: Illustration of the Rate-of-Change Bound (RoCB). The solid line shows the
standard predicted slope, while the dashed line visualized the RoCB. The RoCB uses the band endpoints to compute an uncertainty-aware estimate of biomarker change.
Figure 7: Illustration of the Rate-of-Change Bound (RoCB). The solid line shows the
standard predicted slope, while the dashed line visualized the RoCB. The RoCB uses the band endpoints to compute an uncertainty-aware estimate of biomarker change.
In this experiment, the goal is to identify which MCI subjects are likely to convert to Alzheimer’s Disease. We compare two progression markers derived from longitudinal biomarker trajectories: the model’s predicted rate of change (RoC) and our uncertainty-aware Rate-of-Change Bound (RoCB). For each subject, we compute both quantities and apply a Youden-optimized threshold to decide whether the individual is predicted to progress. RoC reflects the model's best-guess slope, while RoCB incorporates conformal uncertainty and captures the fastest plausible decline consistent with calibrated prediction bands. Evaluating both metrics on MCI converters shows that RoCB substantially improves recall and correctly identifies converters who would otherwise be missed by overconfident models, while simultaneously reducing false positives among stable MCI subjects.
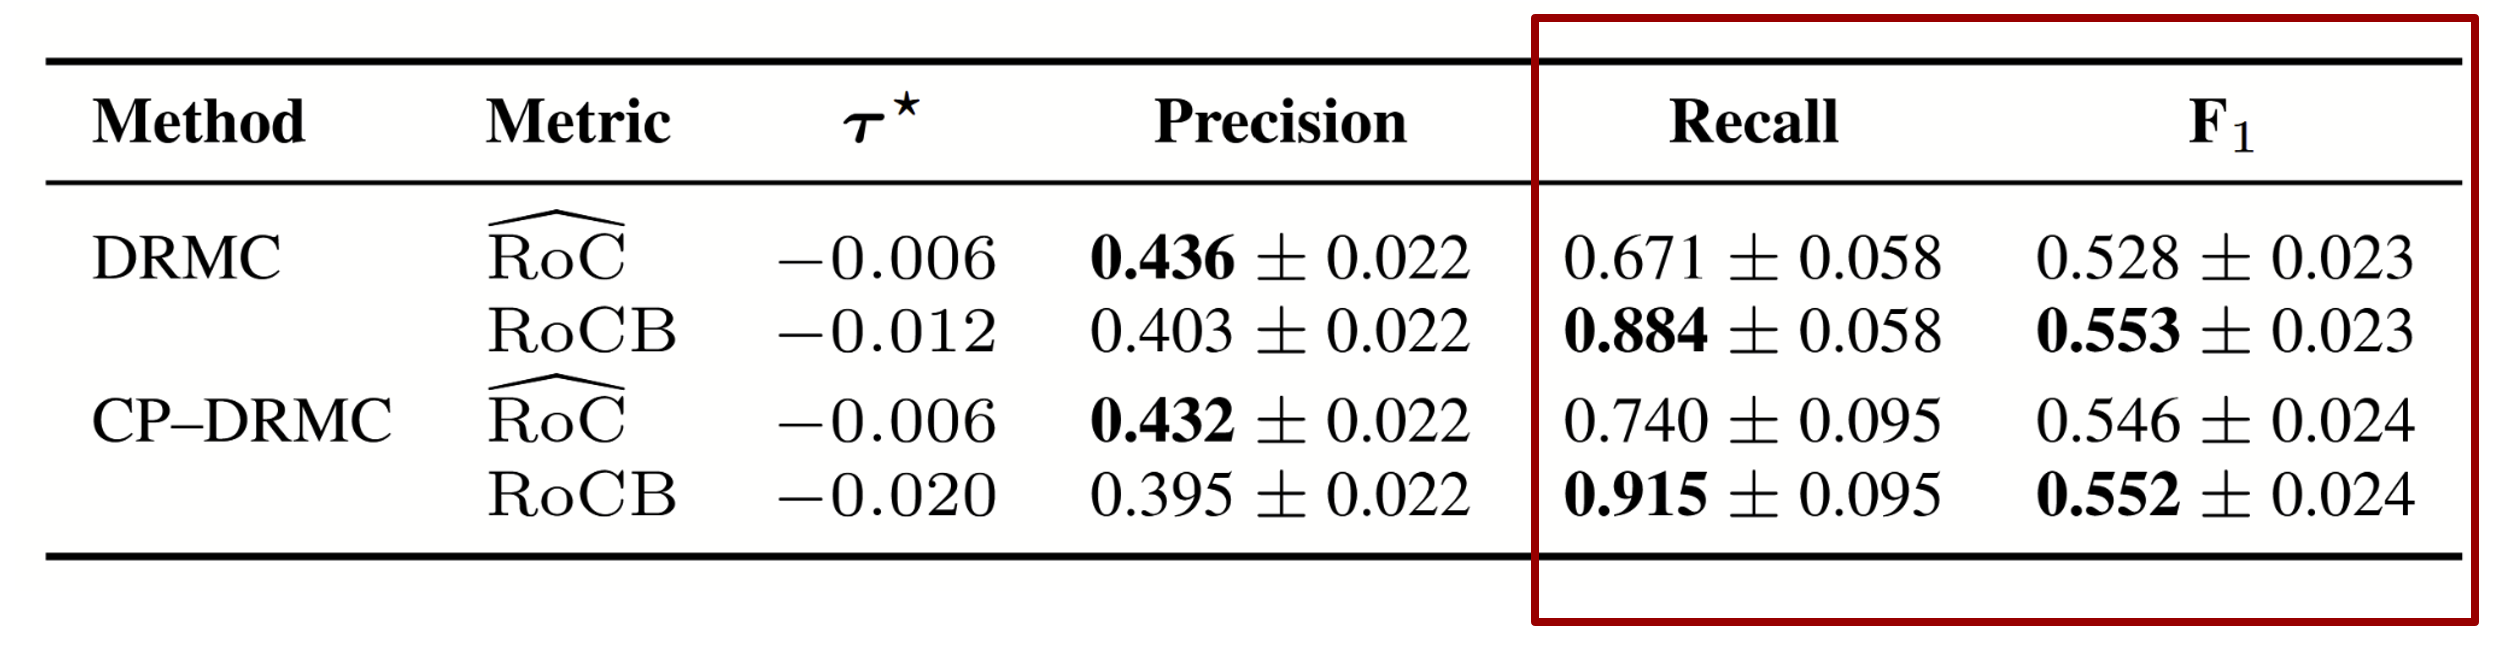 Table: Youden-optimized discrimination on z-standardized predicted rate of change
(RoĈ) and Rate-of-Change Bound (RoCB) for MCI converters, with 95% bootstrap
confidence intervals. For hippocampal volume (a decreasing biomarker), RoCB
corresponds to the lower bound of the interval.
Table: Youden-optimized discrimination on z-standardized predicted rate of change
(RoĈ) and Rate-of-Change Bound (RoCB) for MCI converters, with 95% bootstrap
confidence intervals. For hippocampal volume (a decreasing biomarker), RoCB
corresponds to the lower bound of the interval.
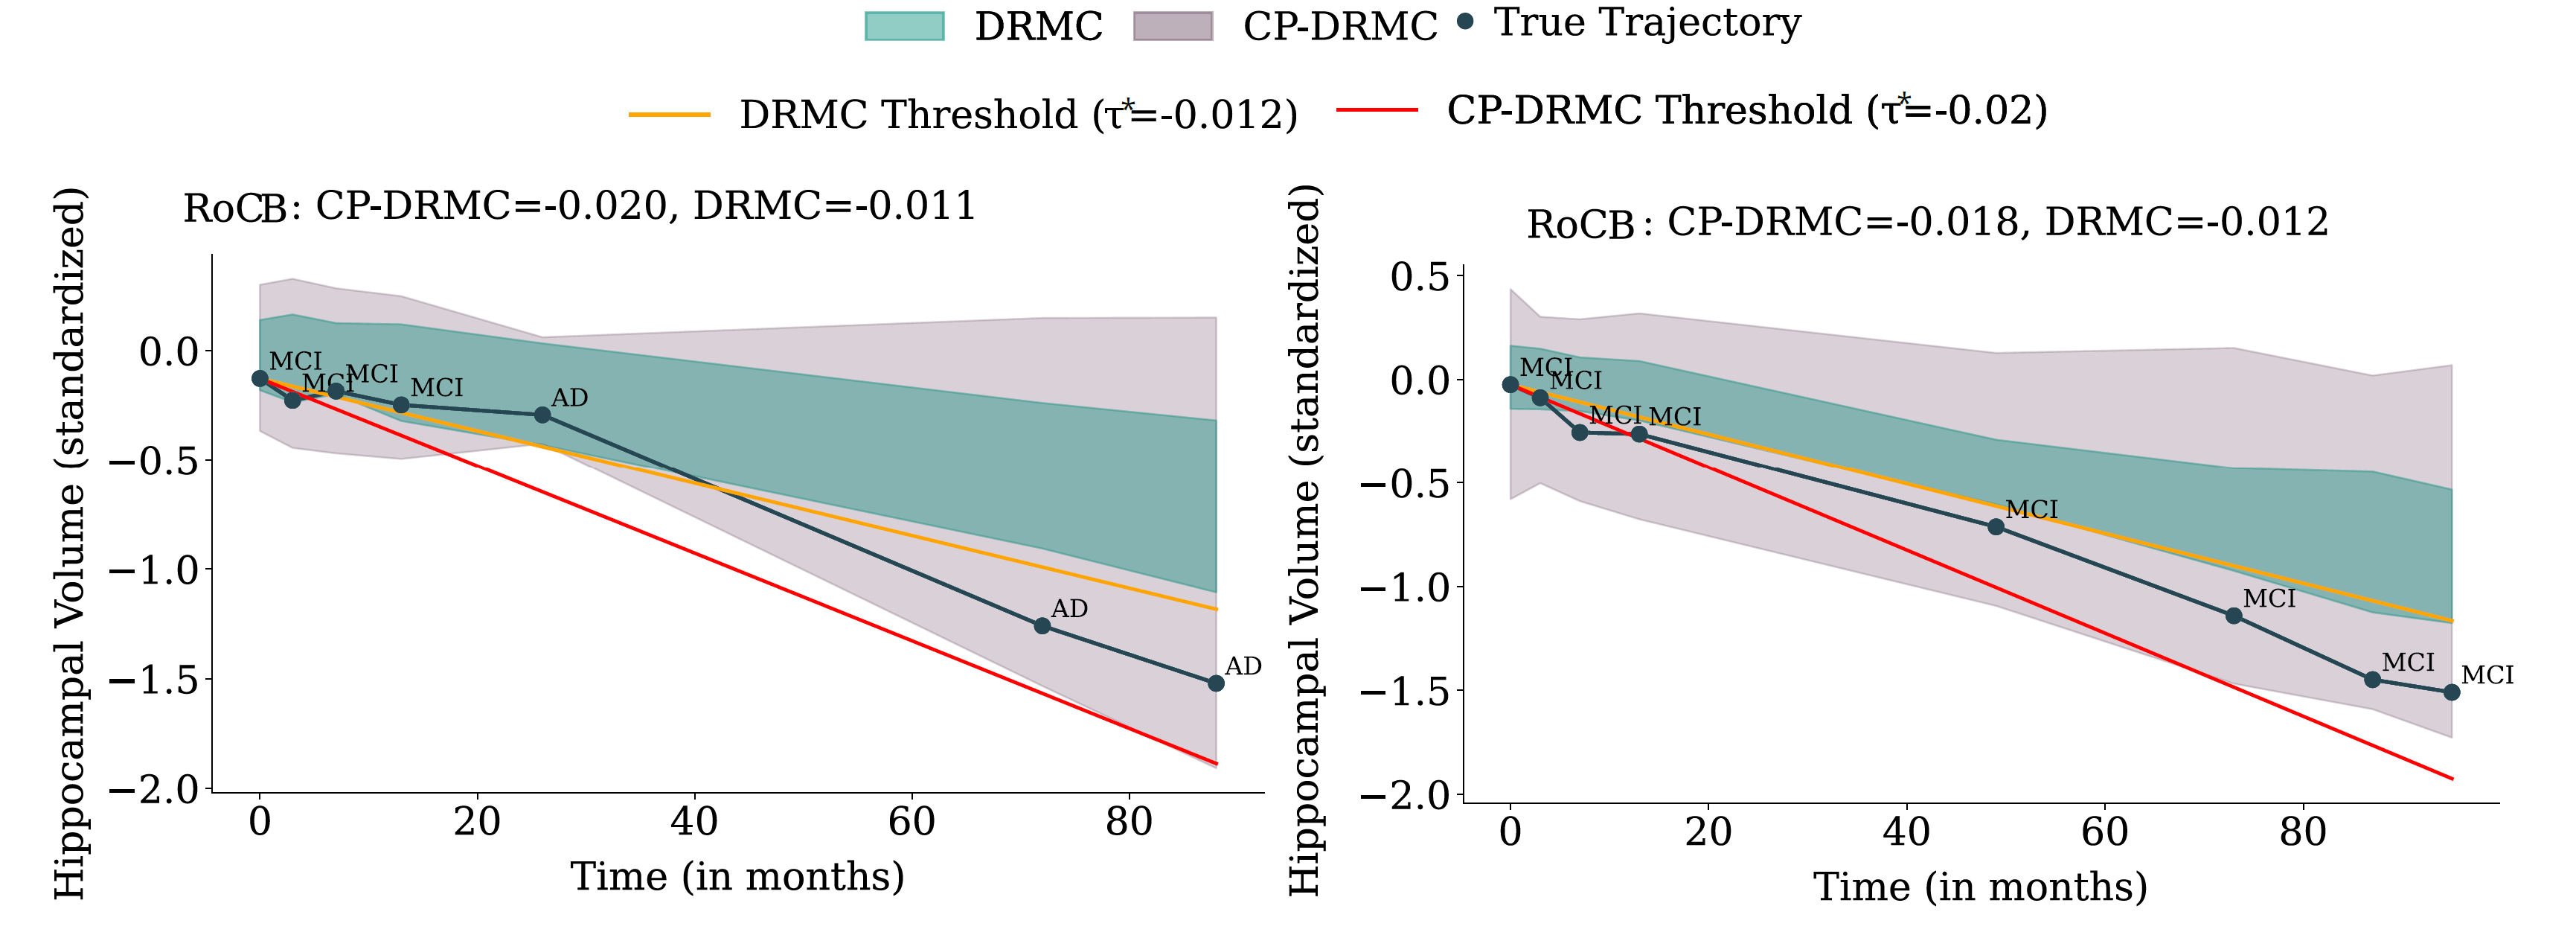 Figure 8: Hippocampal-volume trajectories for two MCI subjects.
Left: a true converter (MCI → AD). The baseline DRMC model produces an overconfident band
that misses the trajectory and underestimates decline, yielding an RoC estimate that fails
to cross the progression threshold. After conformalization (CP-DRMC), the band shifts
downward, the RoCB becomes more negative, and the subject is correctly flagged as high-risk.
Right: a non-converter who remains MCI. DRMC incorrectly predicts decline leading to a false
positive, whereas the wider CP-DRMC band raises the RoCB above the threshold and prevents
misclassification. These examples illustrate how conformalization both rescues missed
converters and reduces false positives among stable individuals.
Figure 8: Hippocampal-volume trajectories for two MCI subjects.
Left: a true converter (MCI → AD). The baseline DRMC model produces an overconfident band
that misses the trajectory and underestimates decline, yielding an RoC estimate that fails
to cross the progression threshold. After conformalization (CP-DRMC), the band shifts
downward, the RoCB becomes more negative, and the subject is correctly flagged as high-risk.
Right: a non-converter who remains MCI. DRMC incorrectly predicts decline leading to a false
positive, whereas the wider CP-DRMC band raises the RoCB above the threshold and prevents
misclassification. These examples illustrate how conformalization both rescues missed
converters and reduces false positives among stable individuals.
Citation
References
Powered by Jekyll and Minimal Light theme.